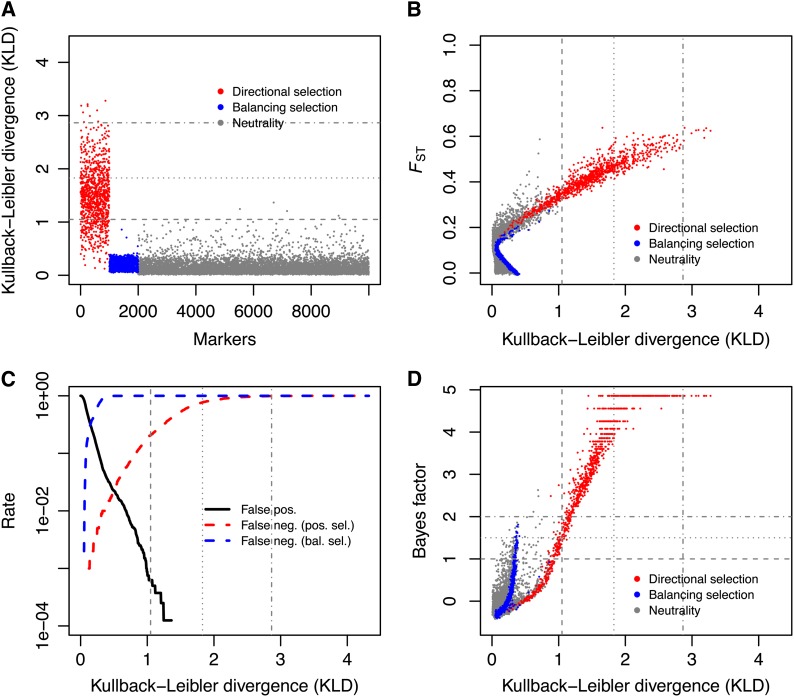
Figure 4.
Analysis of the allele count data from data set 5. (A) Kullback–Leibler divergence (KLD) measure between the posterior of δj and its centering distribution for all simulated loci. Loci under positive selection are depicted in red, loci under balancing selection in blue, and neutral markers are in gray. (B) FST as a function of the KLD measure for all loci. (C) False-positive (neutral loci detected as outliers) and false-negative (selected loci not detected as outliers) rates as a function of the KLD threshold. (D) Relationship between BayeScan Bayes factor log10(BF) and the KLD for all markers in data set 5. Positively selected markers are in red, loci under balancing selection are in blue, and neutral markers are in gray. The horizontal lines in A and the vertical lines in B–D indicate the KLD thresholds corresponding to the 95%, 99%, and 99.9% quantile of the KLD distribution from the POD analysis of data set 5. In D, the horizontal dotted lines indicate the log10(BF) = 1, log_10(BF) = 1.5 and log10(BF) = 2 thresholds, which correspond to strong, very strong and decisive support following Jeffreys’s (1961) scale of evidence for selection, respectively.

