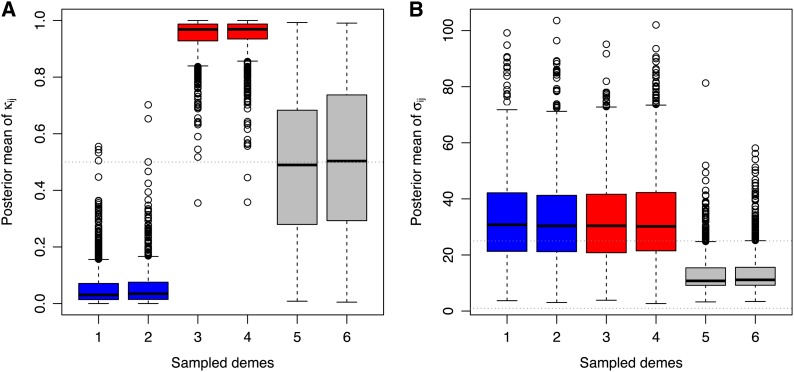
Figure 6.
Analysis of the allele count data from data set 5. (A) Boxplot representation of the posterior means of the parameters κij (which indicate which allele is selected for) for the 1000 positively selected loci in blue demes (1–2), red demes (3–4), and uncolored demes (5–6). (B) Boxplot representation of the posterior means of the selection coefficients σij for positively selected loci in data set 5. For blue demes, the posterior means of the selection coefficients σij are conditional upon the blue allele being selected for (κij = 0). For red demes, the posterior means of the selection coefficients σij are conditional upon the red allele being selected for (κij = 1). For uncolored demes, the posterior means of the selection coefficients σij are unconditional. The horizontal dashed line gives the true (simulated) value of σij = 25.

