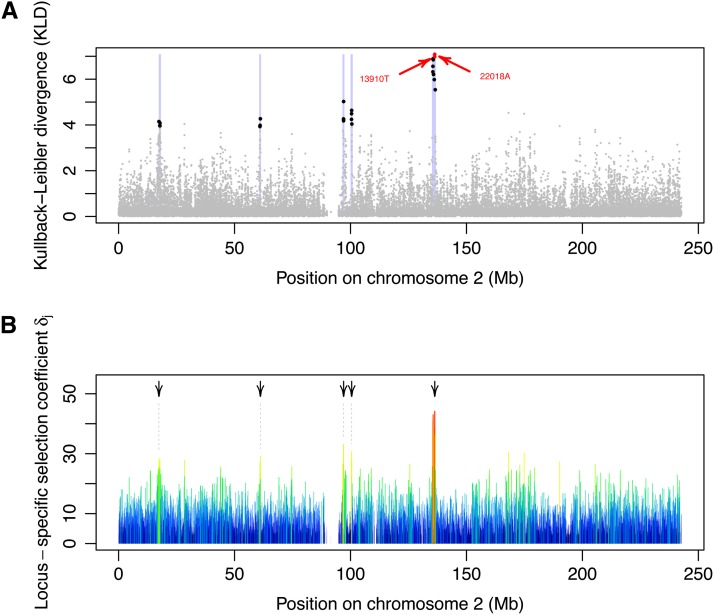
Figure 8.
Analysis of the HGDP–CEPH data. (A) KLD between the posterior of δj and its centering distribution. The genomic regions highlighted in light purple show the strongest signatures of selection in the HGDP–CEPH data. They correspond to sets of 1-Mb windows (centered around each marker) containing at least three SNPs above the critical KLD value of 3.924 (corresponding to the 99.9% quantile of the KLD distribution from the POD analysis). For each region, the SNPs with KLD ≥ 3.924 are shown in black. The alleles −13910T and −22018A associated with lactase persistence are shown in red. (B) Locus-specific selection coefficient δj along chromosome 2. The color (from blue to red) and the width of each segment is proportional to the strength of selection. The arrows highlight the five outstanding genomic regions highlighted in A. The closest gene from each of these regions is provided in Table 2.

