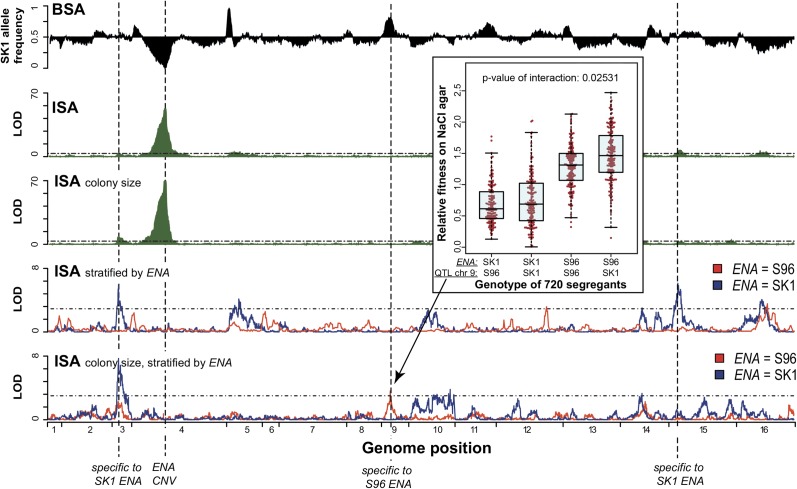
Figure 4.
Identification of high-salt QTL. For BSA, SK1 allele frequency is plotted in black (replicates were highly reproducible and therefore only one is shown). For ISA results, the LOD scores are plotted in green. In addition to the standard method (1–2 days liquid culture), ISA phenotyping was also performed by a colony-size assay on agar (2–4 days) to account for the effects of growth duration. The major QTL identified by all approaches was the ENA locus on chr 4 (ENA CNV), which contains a cluster of genes encoding sodium pumps. By stratifying the ISA samples according to their ENA genotype (S96 ENA, red; SK1 ENA, blue), QTL specific to SK1 ENA (chr 3 and chr 15 for liquid culture) and S96 ENA (chr 9 for colony-size assay) were detected. The synergistic effect of the QTL on chr 9 in combination with ENA is also illustrated in the boxplot using the individual fitness (according to colony size) of 720 segregants. To test for interactions, we used an ANOVA test. A linear model was fitted to the data: phenotype ~ QTL1 + QTL2 + QTL1:QTL2 . The P-value for the interaction is the significance of including the interaction term (QTL1:QTL2).

