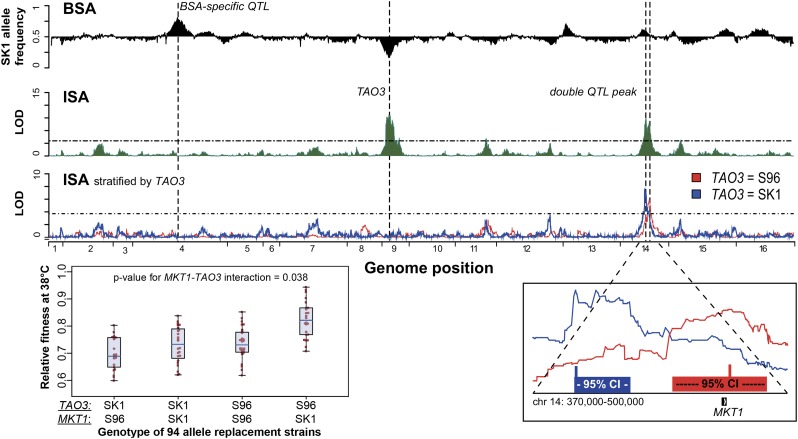
Figure 5.
Identification of high-temperature QTL. BSA and ISA results are plotted as in Figure 4. By stratifying the ISA samples by the major QTL (S96 TAO3, red; SK1 TAO3, blue), the double QTL peak on chr 14 could be separated into two individual QTL—chr 14: 390,000–410,000 for the SK1 TAO3 subset and chr 14: 480,000–500,000 for the S96 TAO3 subset. A magnification of this region is shown in the bottom right, with 95% confidence intervals and the calculated maximum shown as boxes below the separated peaks. The synergistic interaction between the S96 TAO3 and the SK1 MKT1 was confirmed in 94 allele replacement strains (bottom left boxplot). The P-value for interaction was calculated as described in the legend of Figure 4.

