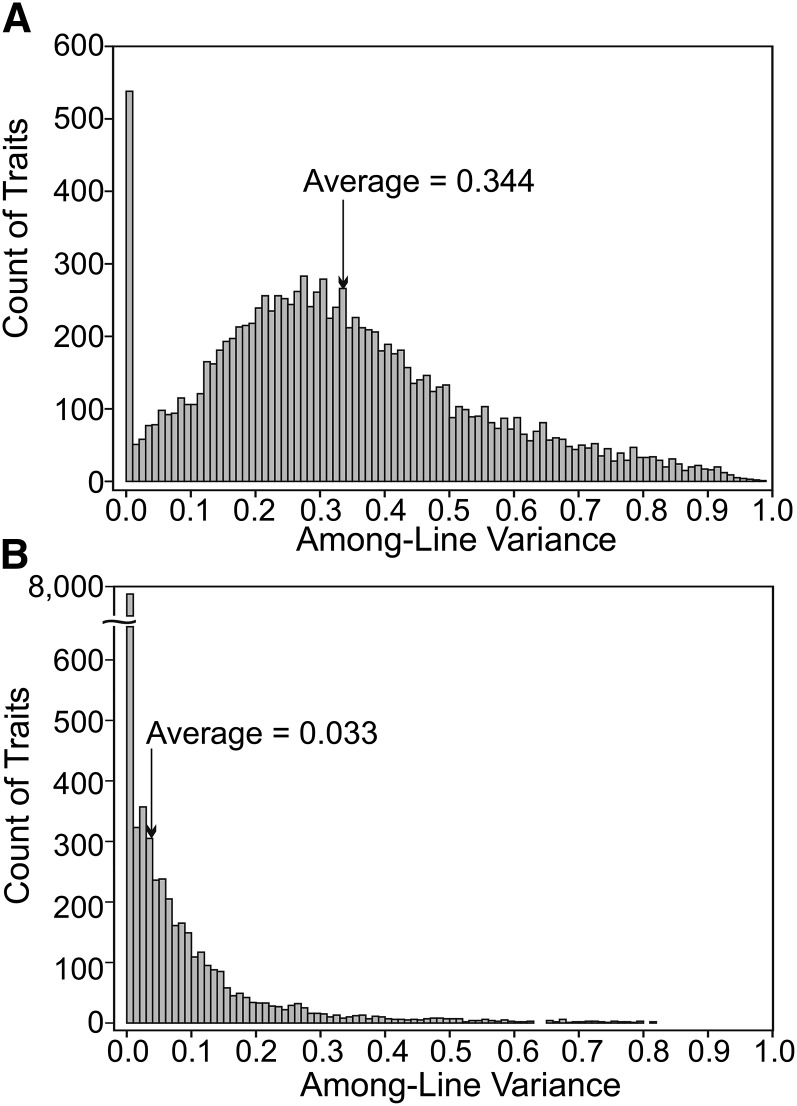
Figure 1.
The distribution of genetic variance for 11,604 expression traits in two experimental populations of Drosophila serrata. (A) Standing genetic variance among 30 inbred lines derived from an outbred population. (B) Genetic variance among 41 MA lines, founded from a single inbred ancestral line, after 27 generations of mutation accumulation. Both graphs are on the scale of broad-sense heritability, in the case of the MA lines, cumulative across the 27 generations.

