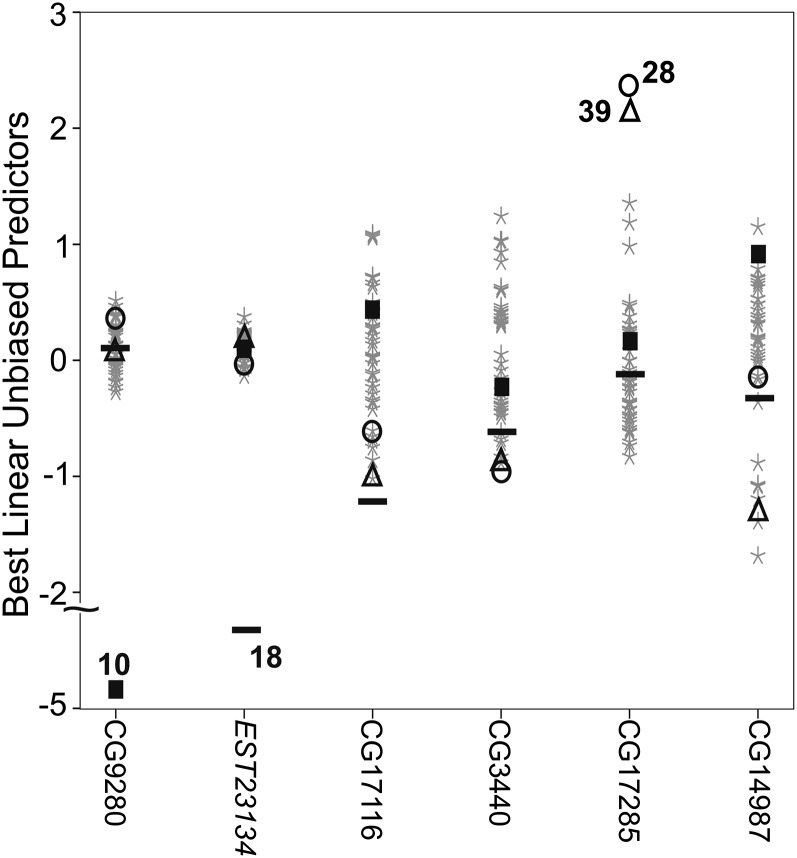
Figure 3.
Illustration of mutational variation among MA lines. The best linear unbiased predictors (BLUPs) of each line (i.e., points on the graph) are plotted for six traits with similar mutational heritabilities. Traits are identified by their D. melanogaster gene ortholog annotation, with the exception of EST23134, for which no D. melanogaster ortholog was found. BLUPs are deviations from the population mean, here, on the scale of phenotypic standard deviations, with positive (increased expression) and negative (decreased expression) deviations. Some individual MA lines (10, square; 18, bar; 28, circle; and 39, triangle) are uniquely identified for illustration, and the same symbol is used to indicate the BLUPs of these lines for each gene.

