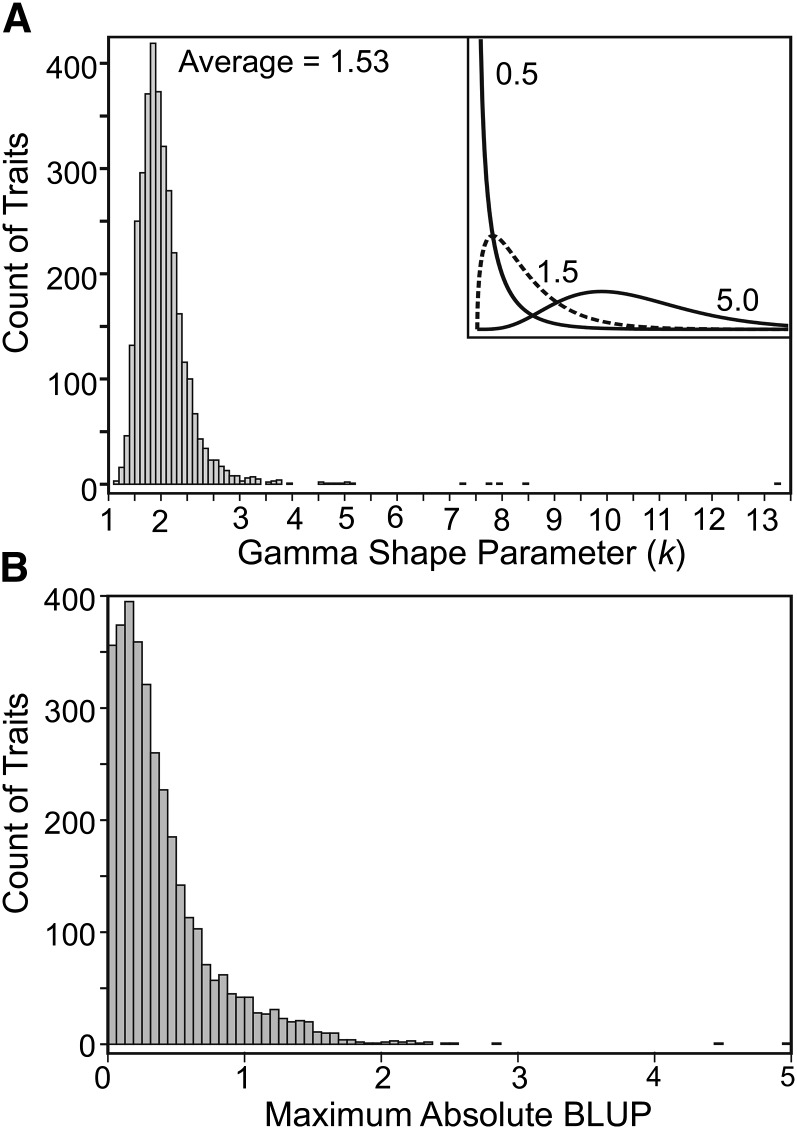
Figure 4.
The distribution of the mutational effects for individual traits. (A) The distribution of gamma shape parameters for each trait, including an illustration of curve shapes for different shape parameter values (inset). (B) The distribution of the largest absolute best linear unbiased predictors (i.e., deviations from the population mean breeding value), for each trait, plotted as phenotypic standard deviations.

