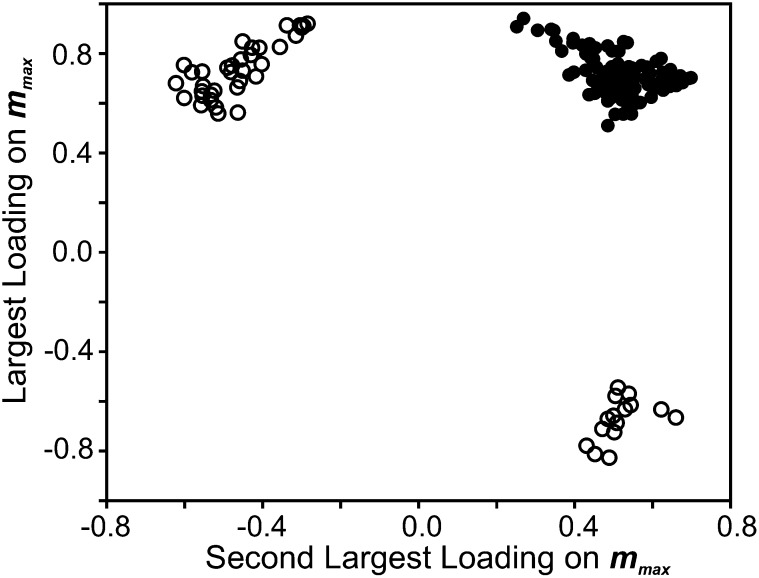
Figure 6.
The distribution of the direction of mutational covariances. Plotted are the largest (y-axis) and the second largest (x-axis) contributions of traits to the normalized mmax eigenvectors of the 145 matrices that were significant at 5% FDR. Negative and positive covariances are revealed by opposing directions of contribution (open circles) and coincident directions of contribution (solid circles), respectively. Directions of trait loading on mmax do not correspond to up- vs. downregulation of gene expression. Eigenvector direction can be arbitrary, such that the largest loading is typically positive. Thus, negative loadings from the two traits with the largest two contributions were not observed in this subset of the data, but would reveal the same positive mutational covariance as positive loadings of two traits with the largest contributions to mmax (i.e., solid circles).

