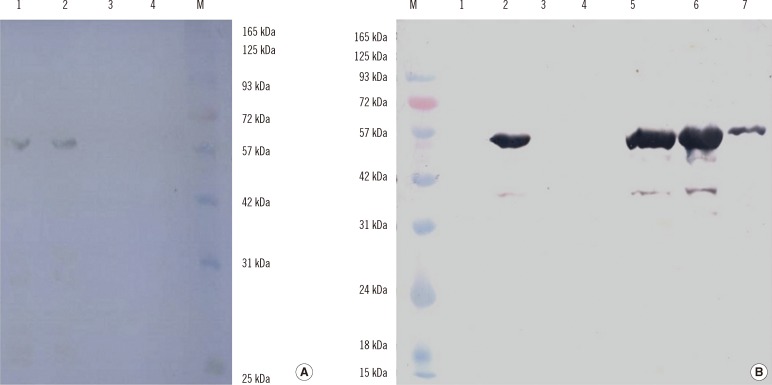
Fig. 4.
Western blot analysis of the expressed and purified ORF2.1 and ORF2.2 protein in E. coli. (A) The ORF2.1 protein band is visualized at approximately 60 kDa. Lane 1, induction for 2 hr; Lane 2, induction for 4 hr; Lane 3, uninduced control; Lane 4, BL21 control; Lane M, pre-stained protein ladder (Cinagen, Tehran, Iran). (B) The ORF2 protein band is visualized at approximately 55 kDa. Lane M, pre-stained protein ladder (Cinagen, Tehran, Iran); Lane 1, uninduced control; Lane 2, induction for 4 hr; Lane 3, flow-through; Lane 4, wash; Lane 5-7, the first, the second, and the third eluates.
Abbreviation: ORF, open reading frame.

