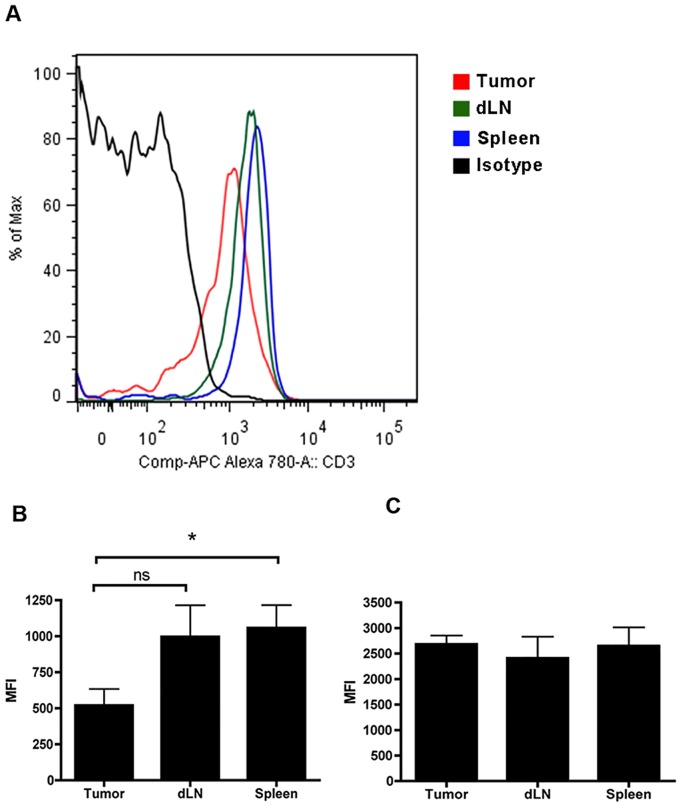
Figure 9. Surface expression of CD3ε on MCA-205-OVA tumor infiltrating CD8 T cells is reduced compared to CD8 T cells from spleens of tumor bearing mice.
A, B) B6 mice were injected with MCA-205-OVA tumor cells and tumors were excised and digested once they reached a diameter of 15 mm. The expression levels of surface CD3ε on CD8 T cells from tumor, draining lymph node (dLN) or spleen of tumor bearing mice was determined by flow cytometry. A) A representative histogram of CD3ε expression is shown. B, C) MFI of CD3ε expression on CD8 T cells (B) or CD4 T cells (C) from either tumor, draining lymph node (dLN) or spleen of mice with MCA-205-OVA tumors. Data shown is the mean ± SEM from four mice for tumor and spleen, and three mice for draining lymph node. Data were analyzed by ANOVA followed by Tukey's HSD post hoc analyses. *, p<.05; ns, no significance.

