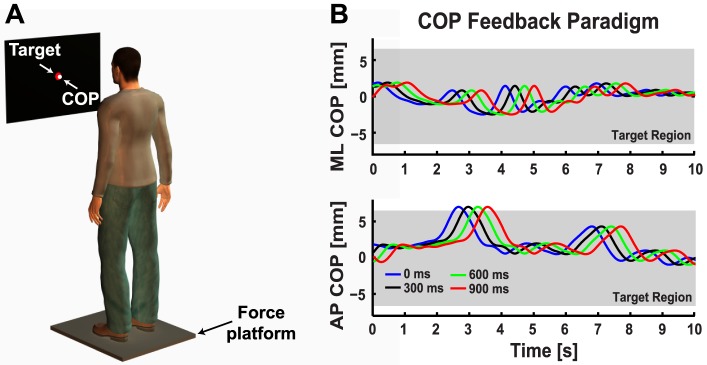
Figure 1. Experimental apparatus and delayed visual feedback paradigm.

A. Schematic of the experimental setup showing the participant standing on the force platform in a comfortable shoulder-width posture with their arms placed at their sides. The visual display was located at eye level in front of the participant and displayed a fixed red circle (13 mm radius) corresponding to the target COP position. In the visual feedback conditions, a white cursor (10 mm radius) displayed the real time (instantaneous visual feedback, 0 ms delay) or delayed (300, 600, 900 ms visual feedback delay) COP position. Participants were instructed to position their COP on the fixed target as accurately as possible throughout the trial. B. Representative data taken from a single trial (31 seconds) performed by a young subject to illustrate how the feedback delay influenced the COP position shown on the visual display. Ten seconds of COP data are plotted to show the effect of the visual feedback delay. The blue traces are the true mediolateral (ML COP, top panel) and anteroposterior (AP COP, bottom panel) COP position displayed in the 0 ms visual feedback delay condition. The black (300 ms delay), green (600 ms delay) and red (900 ms delay) traces correspond to what was shown on the visual display in the delayed visual feedback conditions. Shaded grey region corresponds to the boundaries of the fixed COP target.
