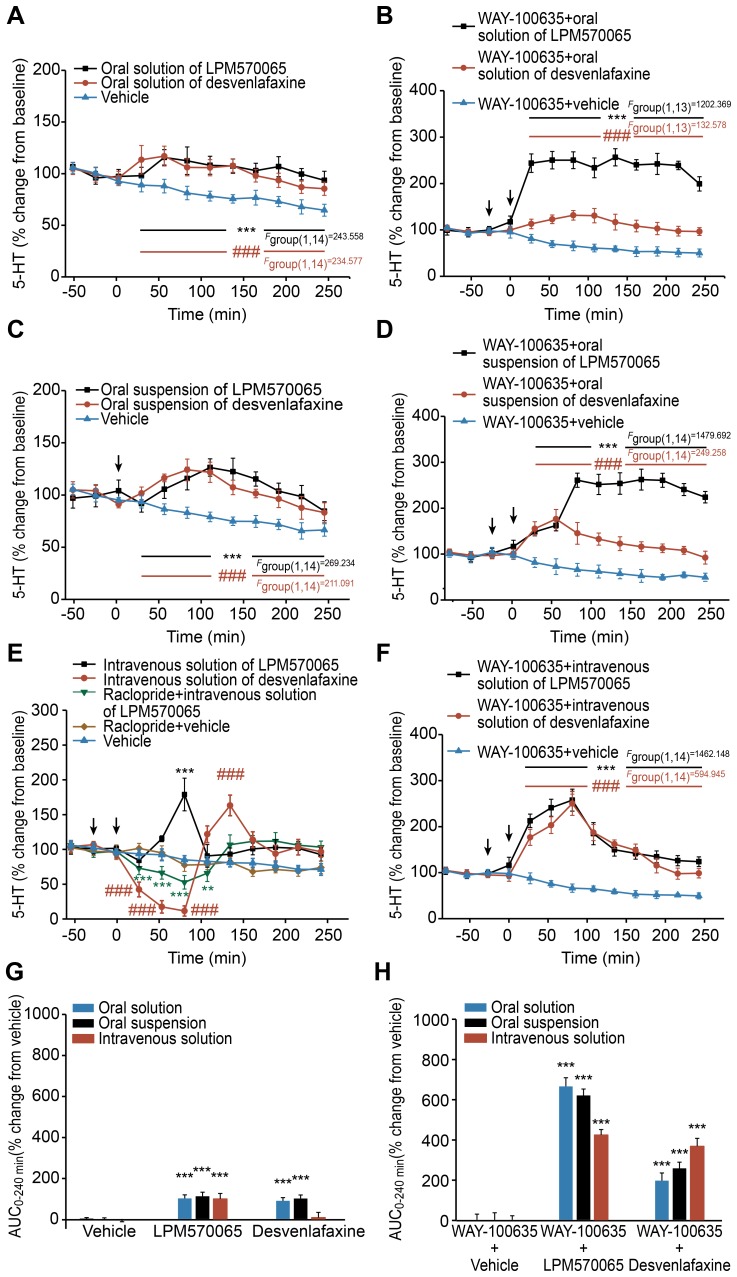
Figure 4. The effects of LPM570065, desvenlafaxine and vehicle on extracellular 5-HT levels after acute administration.
The effects of LPM570065 (black line), desvenlafaxine (red line) and vehicle (blue line) alone on extracellular 5-HT levels in the rat striatum after acute administration using different administration routes are indicated as follows: (A) for oral solution, (C) for oral suspension and (E) for intravenous solution; the effects of WAY-100635 plus LPM570065 (black line), desvenlafaxine (red line) or vehicle (blue line) on the extracellular 5-HT levels in the rat striatum after acute administration using different administration routes are indicated as follows: (B) for oral solution, (D) for oral suspension and (F) for intravenous solution. The effects of raclopride plus intravenous administration of LPM570065 on extracellular 5-HT levels in the rat striatum are also presented in Figure 4E. WAY-100635 (0.3 mg·kg−1 s.c.) or raclopride (0.5 mg·kg−1 s.c.) was administered at time −20 min; LPM570065, desvenlafaxine (0.06 mmol·kg−1 for oral solution; 0.06 mmol·kg−1 for oral suspension; 0.04 mmol·kg−1 for intravenous solution) or the appropriate vehicle was administered at time 0 min. Data are presented as the mean±SD, n = 7–8; ***p<0.001, **p<0.01 LPM570065 vs. relative vehicle; ###p<0.001 desvenlafaxine vs. relative vehicle; two-way ANOVA with repeated measures, Bonferroni’s post-test. The overall effects on extracellular 5-HT levels in the rat striatum following treatment with LPM570065, desvenlafaxine or vehicle alone and WAY-100635 plus LPM570065, desvenlafaxine or vehicle are indicated in (G) and (H), respectively (blue column: oral solution; black column: oral suspension; red column: intravenous solution). The columns represent the AUC0–240 min values calculated as the differences in relative changes in extracellular 5-HT levels over a 4-h period between the drug-treated and relative vehicle-treated groups. Data are presented as the mean±SD, n = 7–8; ***p<0.001 drug vs. relative vehicle; one-way ANOVA.

