Fig. 12.

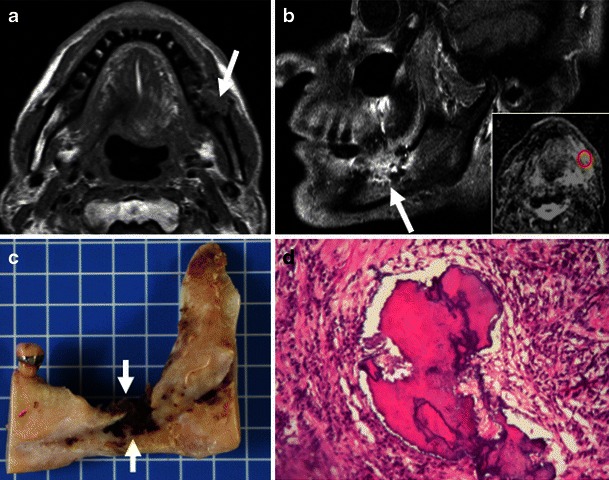
MRI aspect of osteoradionecrosis 2 years after chemoradiotherapy of a tonsillar SCC. a Axial T1-weighted image. b Contrast-enhanced sagittal oblique T1-weighted image and ADC map (small image in b). Bilateral hypointensity of the bony marrow. Large osseous defect with cortical destruction on the left (arrow in a). Marked, non-specific contrast enhancement, bony destruction and necrotic hypointense sequestrae (arrow in b). Note high ADC value (red circle) measured at 1.53 × 10⁻³ mm2/s suggesting inflammation and absent recurrence. c Macroscopic resection specimen. The necrotic area is indicated by arrows. d Histology (haematoxylin-eosin stain, original magnification 40×): necrotic bone trabeculae with inflammatory infiltrative changes in the bony marrow
