
Figure 4. DCs from Cl13 infected mice induce IL-10 expression in naïve LCMV specific CD4 T cells.
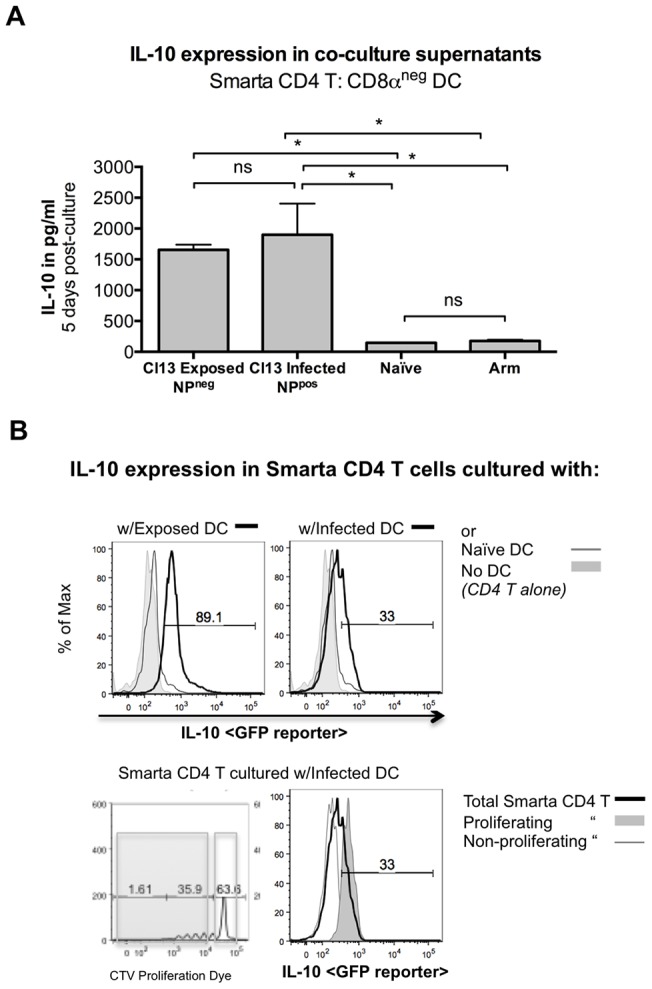
Adult C57BL/6 were infected with Cl13 or Arm and naïve spleens harvested 7 days post-infection. Splenic DCs were sorted based on infected state (NPpos infected, NPneg exposed) and CD8α expression (CD8αneg used exclusively). (A) Sorted DCs were cultured for 5 days with LCMV TCR transgenic (Smarta) CD4 T cells and IL-10 in culture supernatants was measured by ELISA. (B) Smarta mice on an IL-10 GFP reporter background were co-cultured with sorted DCs and IL-10 expression measured by flow cytometry in gated CD4 T cells 3.5 days post co-culture. The top panels show Smarta CD4 T cultured with Cl13 exposed (NPneg) or infected (NPpos) DC (thick black line), or naïve DC (thin grey line) or Smarta CD4 T cells cultured alone (grey filled histogram). The bottom panels show Smarta CD4 T cells cultured with Cl13 infected (NPpos) DC. Thick black line is gated on total live Smarta CD4 T cells, thin grey line is gated on non-proliferating Smarta CD4 T cells, grey filled histogram depicts proliferating Smarta CD4 T cells (based on dilution of CellTraceTMViolet proliferation dye, representative CTV gating shown).