Fig. 5.
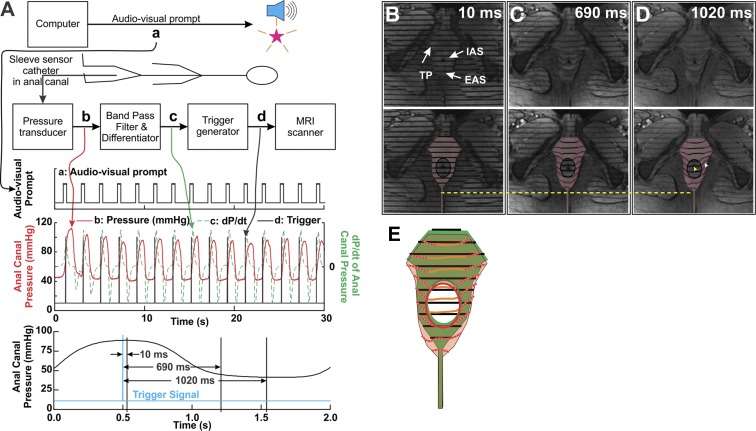
Method of dynamic MRI and results. A: schematic showing signal processing to provide an MRI trigger used for gating the magnetic resonance imager. Audio-video prompt (a) is generated by the computer. In response, the subject generates an anal pressure trace (b, in red). This pressure signal is band-pass-filtered and differentiated (c, in green). Finally, a trigger is generated on the basis of the threshold amplitude of the 1st derivative (black spikes). This signal is used to trigger the magnetic resonance imager. Bottom trace: average anal pressure plot, along with timing (vertical lines) of the 3 magnetic resonance-tagged images in B, C, and D. B–D: 3 different phases (10, 690, and 1,020 ms) of the pressure (contraction/relaxation) cycle, after the start of the spin tag (top). Regions of the EAS, IAS, and anococcygeal raphe with the tag lines are highlighted to show distortions of the tag lines, depicting motion in different regions (bottom). With EAS relaxation, 1) the entire anal complex moves dorsally, 2) tag lines at the inner edge of the EAS, adjacent to the IAS, move dorsally significantly less than tag lines at the outer edge (away from the IAS) of the EAS (25% vs. 6%), and 3) tag lines do not distort within the IAS region. If the muscle fibers of the EAS were circularly oriented and contracted/relaxed isometrically, one would not observe differential movement across its transverse thickness, unlike movement in these images of EAS region. Finally, the direction of distortion of the EAS tag line on either side, when viewed in combination, indicates that the directions of the fibers cross in the PB. E: superimposed tag lines from B and D, bottom. Green region with black lines represents data from B; pink region with red and orange lines represents data from D. Note displacement of the IAS region with minimal distortion of tag lines and distortion of tag lines in the EAS region.

