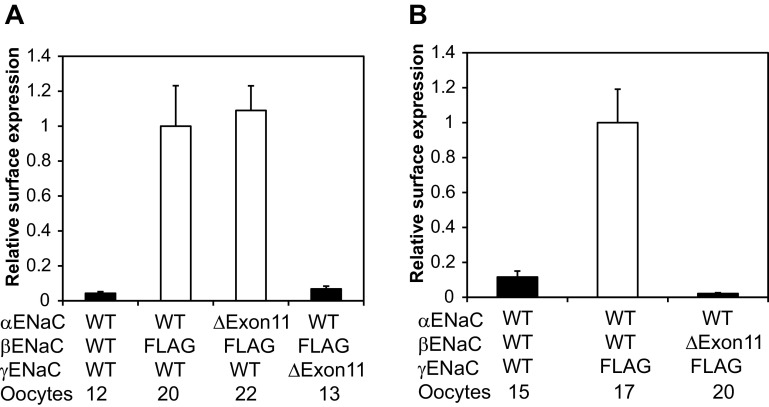
Fig. 3.
Effects of exon 11 region deletions on the surface expression of hENaCs. Oocytes were injected with the three hENaC subunit cRNAs shown at the bottom. For α- and γ-subunit mutants, a β-subunit with a FLAG epitope was included in all groups in A except for the negative control (left bar), whereas a γ-subunit with a FLAG epitope was used for the β-mutant in B. Relative light units measured from individual oocytes were normalized to the average relative light units of oocytes expressing the FLAG control (αβFLAGγ in A and αβγFLAG in B). The solid bars indicate that the values were significantly different from the FLAG control group (P < 0.01).

