Fig. 5.
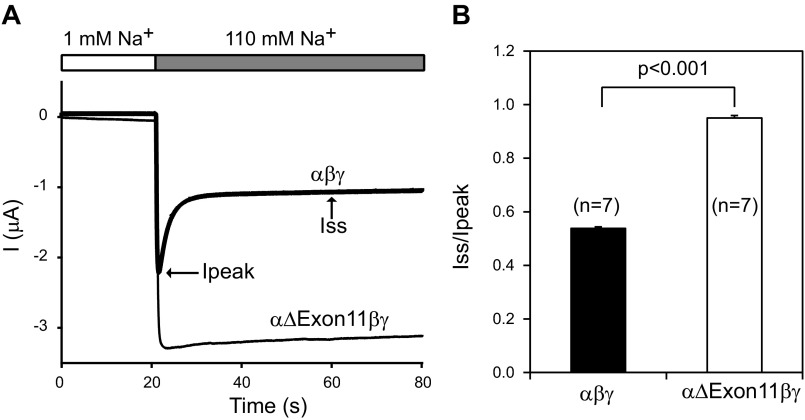
Exon 11 region deletion from the α-subunit eliminates Na+ self-inhibition. A: representative traces for Na+ self-inhibition responses. Oocytes were clamped at −100 mV, and whole cell currents were continuously recorded while bath Na+ concentration was rapidly increased from 1 mM (open bar) to 110 mM (gray bar). Inward currents are shown as negative values by convention. The current (I) decline after the increase in bath Na+ concentration from a peak current (Ipeak) to a steady-state current (Iss) represents Na+ self-inhibition. The current traces for αβγ (WT; thick line) and αΔExon11βγ (thin line) are superimposed on the same scales. B: magnitude of Na+ self-inhibition responses of WT and mutant channels. Iss/Ipeak values were obtained as described in materials and methods.

