
Fig. 7.
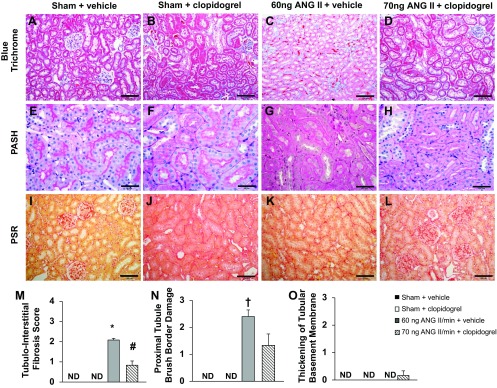
A–L: representative images of tubular structure in the four experimental groups stained with Masson's blue trichrome (A–D), PASH (E–H), or PSR (I–L). Bars = 100 μm in A–D and I–L and 50 μm in E–H. M–O: quantification of tubule-interstitial fibrosis (M), degree of damage to the proximal tubule brush border (N), and degree of tubular basement membrane thickening (O). * P < 0.05 vs. all other groups; #P < 0.05 vs. the 60 ng ANG II/min + vehicle group; †P < 0.05 vs. the sham + vehicle and sham + clopidogrel groups.