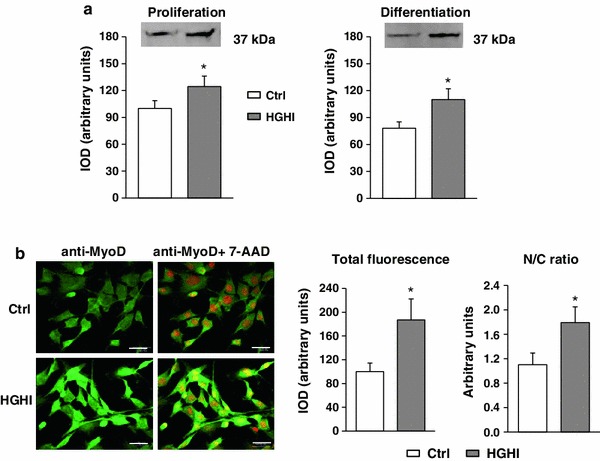
Fig. 8.

Effect of high glucose and high insulin combination (HGHI, glucose concentration 15 mmol/l insulin concentration 50 nmol/l) on MyoD in C2C12 myogenic cell cultures. a The level of MyoD in whole cell lysates of proliferating myoblasts (“Proliferation”) or in 72 h after induction of myogenesis (“Differentiation”) was evaluated by immunoblotting. The densitometric quantitation of the specific bands (IOD, integrated optical density) is presented in arbitrary units with the value obtained in control (Ctrl) proliferating cells set as 100 %. As three separate experiments gave a similar pattern of results, all data within each group were combined to calculate mean ± SD, with n = 9/treatment conditions, and representative blots were presented. b Cellular content and localization of MyoD in mouse C2C12 myoblasts proliferating for 24 h in 2 % FBS/DMEM (Control, Ctrl) or in the presence of HGHI. Cell cultures were stained with antibodies against MyoD (green), and simultaneous nuclear staining with 7-AAD (red) was performed. Images are representative of ten independent fields in three separate experiments. Bar 20 μm. The IOD values of MyoD-related green fluorescence were evaluated using MicroImage analysis system (Olympus Optical Poland). The data were presented as mean ± SD with n = 10/treatment conditions of total fluorescence of fields with similar cell density and as a nucleus/cytoplasm immunofluorescence ratio. Asterisk indicates significantly different vs. control (Ctrl) for the same parameter and the same culture conditions
