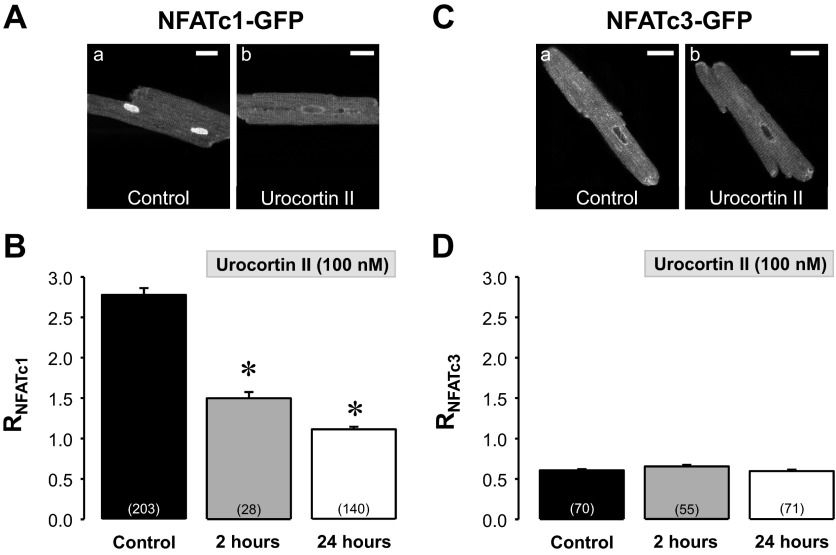
Fig. 1.
Urocortin II (UcnII) induced nuclear factor of activated T-cells (NFAT)c1 and NFATc3 translocation. A: confocal images of subcellular distribution of NFATc1-green fluorescent protein (GFP) in ventricular myocytes in the absence (a; control) and presence (24 h) of UcnII (b). B: average NFATc1 ratio (RNFATc1) in control and after 2 and 24 h UcnII treatment. C: confocal images of NFATc3-GFP distribution in control (a) and UcnII-treated (b) myocytes. D: average RNFATc3 in control and after 2 and 24 h UcnII treatment. Number in parentheses indicate number of individual cells. *P < 0.001 vs. control. Scale bar = 20 μm.

