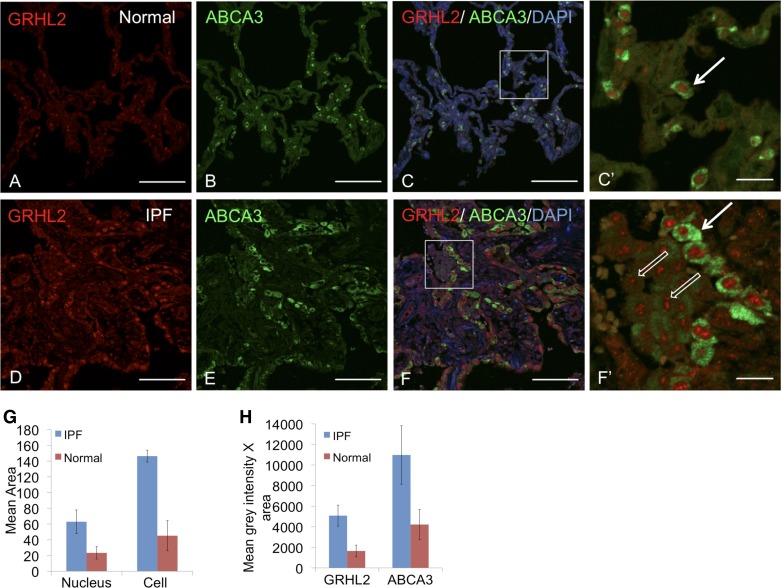
Fig. 3.
GRHL2 and ABCA3 localization shows 2 subtypes of alveolar type II cells. Double staining of GRHL2 and ABCA3 in normal lung (A–C) and in IPF lung (D–F). C′ and F′ are insets of their respective images. In C′ and F′ white arrow indicates a subtype of alveolar type II cells that show bright GRHL2 and ABCA3 signals, whereas open white arrows in F′ indicate another subtype with lower fluorescence intensity for GRHL2 and ABCA3 signals. Insets do not show DAPI for clarity. Scale for A–F is 100 μm and for C′ and F′ it is 20 μm. Mean area of cells (4–7 in number) from inset F and F′ was calculated in G. Mean gray intensity × area was also calculated from same inset as shown in H. To calculate the intensity we compared cell with high fluorescence intensity for GRHL2 and ABCA3 in IPF with alveolar cells in normal type II cells.

