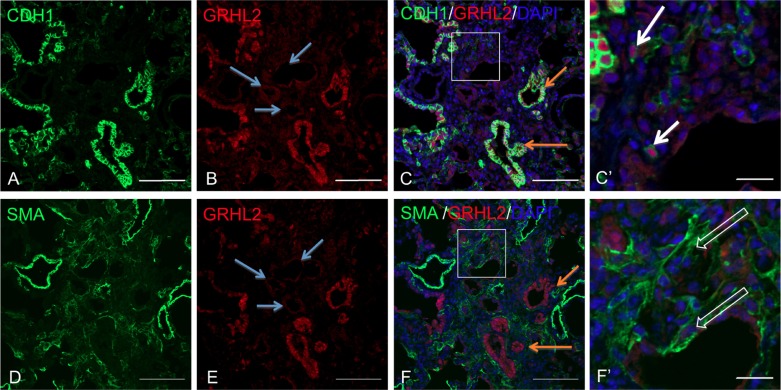
Fig. 8.
Grhl2 expression pattern in serial section of lung from irradiation mouse model. Double staining of Grhl2 and Cdh1 is shown in A–C and C′. Double staining of Grhl2 and α-SMA is shown in D–F and F′. C′ and F′ are insets. White arrows in C′ and open arrows in F′ indicate alveolar epithelial cells (AEC) in same region is undergoing cell-flattening events. Blue arrows show collapsed alveolar spaces with AEC showing low Grhl2 fluorescence intensity. Orange arrows in C and F show airway epithelium with high GRHL2 and Cdh1 signal but no α-SMA signal. Scale bar for A–F is 100 μm, and for C′ and F′ it is 20 μm.

