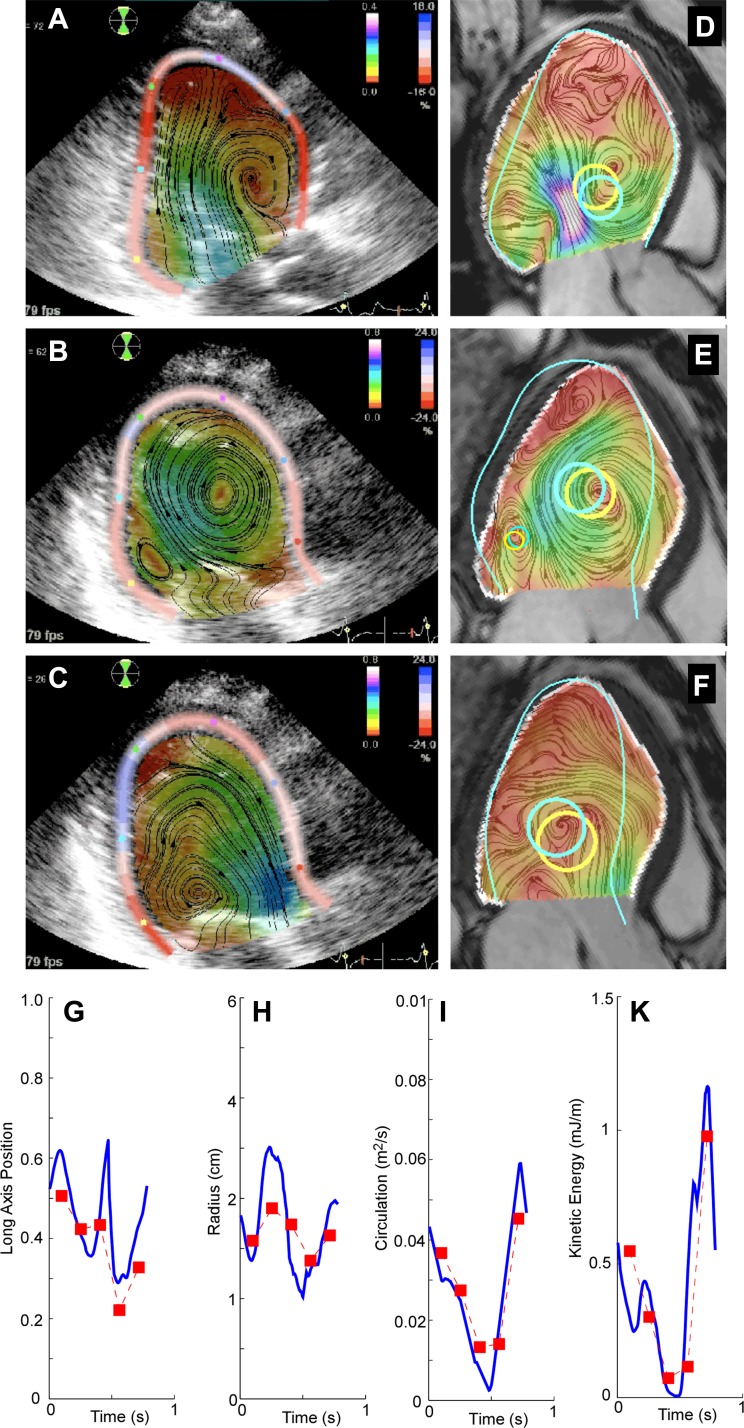
Fig. 3.
A–F: head-by-head comparison between echocardiography and phase-contrast magnetic resonance (PC-MR) for vortex size and position in a patient with NIDCM for early filling (A and D), late filling (B and E), and ejection (C and F) phases. A–C: results of the ultrasound-based 2-D velocity fields. The distributions of flow velocity and longitudinal myocardial strain are overlaid on the raw B-mode tissue images. D–F: time-matched PC-MR frames. The endocardial boundary from the MR is overlaid in white, whereas the endocardial boundary from the ultrasound is overlaid in cyan, normalized for the same long-axis length. Automatically identified vortex structures are overlaid as yellow and cyan for the PC-MR and ultrasound methods, respectively. The secondary vortex structure could only be identified during late filling (B and E). G–K: vortex properties along the cardiac cycle, as measured by ultrasound (blue line) and PC-MR (red squares) in another patient with NIDCM.

