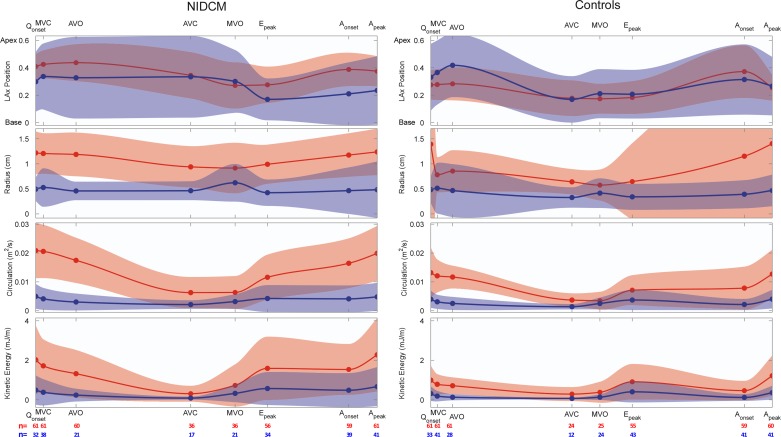
Fig. 4.
Mean (solid curves) and SD (light ribbons) values of vortex properties along the cardiac cycle for patients with NIDCM (left) and control subjects (right). Properties are shown for the main and secondary vortex cores (red and blue, respectively). The horizontal axes have been scaled for average times of cardiac events in each population. The number of subjects in which the main (red) and secondary (blue) cores were identified in each phase is shown at the bottom. Qonset, onset of the Q wave; MVC, mitral valve closure; AVO, aortic valve opening; AVC, aortic valve closure; MVO, mitral valve opening; Epeak, peak of the E wave; Aonset, onset of the A wave; Apeak, peak of the A wave; LAx, long axis.

