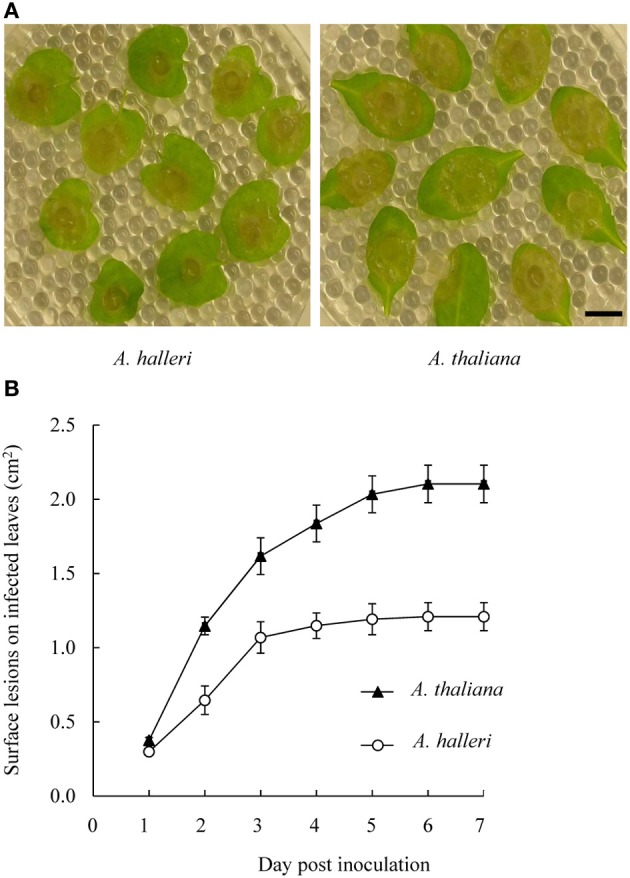
Figure 5.

Disease development on A. thaliana and A. halleri leaves following B. cinerea inoculation. Leaves were inoculated with 3 mm diameter mycelium plugs of B. cinerea (A) Spreading lesions on A. halleri leaves (left) and on A. thaliana leaves (right) were photographed 3 days post-inoculation (dpi). Bar = 1 cm. (B) Surface lesions on infected leaves were measured daily up to 7 dpi. For each genotype, mean lesion surface values were determined from ~20 inoculated leaves derived from 6 plants grown in soil. Error bars represent standard deviations. A Kruskal-Wallis statistical test was performed and all A. thaliana measurement values showed significant differences (p < 0.005) with A. halleri measurement values from 2 dpi.
