
Figure 3.
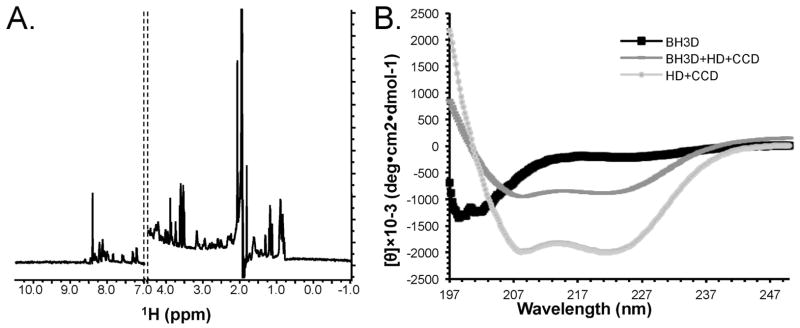
Structure of the BECN1 BH3D: (A) 1D-1H NMR spectrum. Only 1H chemical shifts between −1.0 ppm to 4.5 ppm (methyl region) and 7.0 ppm to 10.5 ppm (amide) are shown. (B) CD spectra of the BECN1 BH3D (black squares), HD+CCD (light gray circles), and BH3D+HD+CCD (dark gray dashes).