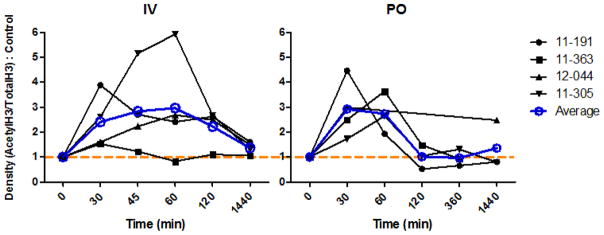
Figure 3.

Pharmacodynamic profiles of SAHA in 4 cats administered 2 mg/kg IV (A) or 250 mg/m2 orally (PO) (B). Leukocytes collected at various time points after SAHA administration were analyzed by Western blotting for both acetylated and total histone H3. Densitometry ratios of acetyl H3/total H3 were normalized to pre-dose controls (time 0). Values above the dashed orange line (1) have a relative increase in histone H3 acetylation. Cat numbers are shown on the right, and the average for each time point is superimposed on the plot (blue lines and circles). X-axis time scale is not proportional.
