
Figure 5.
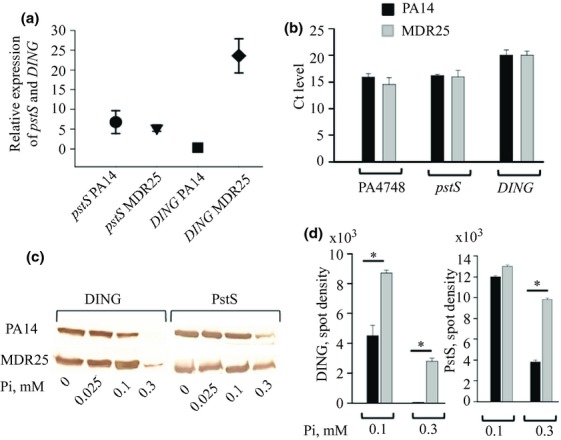
Comparative analysis of PstS and DING expression in PA14 and MDR25. (a) QRT-PCR analysis demonstrating > 20 higher expression of DING in MDR25 compared with PA14. The expression of pstS and DING was normalized to PA4748. (b) Ct levels of PA4748, pstS, and DING determined by quantitative PCR using 1 ng DNA as a template demonstrating no differences in gene copy numbers. (c) Immunoblot analysis of PstS and DING production by PA14 and MDR25 grown in citrate defined media varying in phosphate concentrations demonstrating that MDR25 has higher threshold sensitivity to phosphate level. (d) Quantitative evaluation of immunoblot analysis. n = 3/group, *P < 0.01.