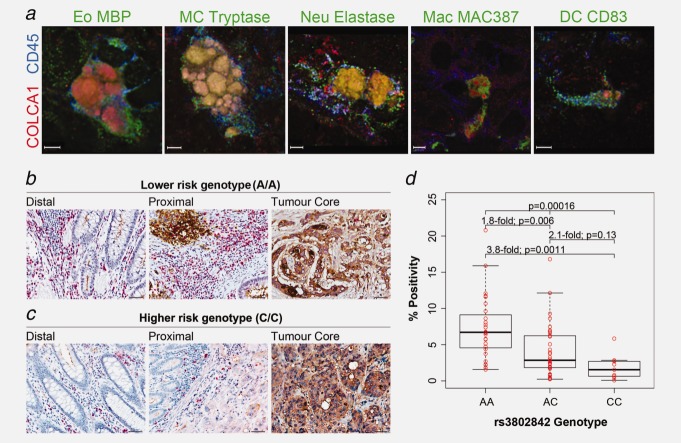
Figure 4.
COLCA1 expression in immune cells in colon tissues and association with rs3802842. (a) Co-localization of COLCA1 with specific immune cell subsets markers was assessed on cryosections from colon tumor biopsies using three-dimensional deconvolution microscopy. High-power images of single immune cells were taken at sequential 0.1–0.3 µm z axis depth separation (scale bars, 3 µm). For all images, COLCA1 staining is shown in red and a pan-leukocyte marker (CD45) is shown in blue. Green signals represent different immune cell-specific markers: eosinophils (Eo) labeled with eosinophil major basic protein (MBP); mast cells (MC) labeled with mast cell tryptase; neutrophils (Neu) labeled with neutrophil elastase; macrophages (Mac) labeled with MAC387; dendritic cells (DC) labeled with CD83. (b, c) Double immunohistochemical staining for COLCA1, red and CEA, brown, in distal, proximal and tumor core of colon tissues from patients homozygous for the lower risk rs3802842 genotype (AA) (b), compared to the higher risk genotype (CC) (c) (scale bars, 50 µm). (d) Association analyses between genotypes at rs3802842 and COLCA1 expression in TMAs. Individual expression values and corresponding boxplots are illustrated. Thick horizontal lines represent median values.

