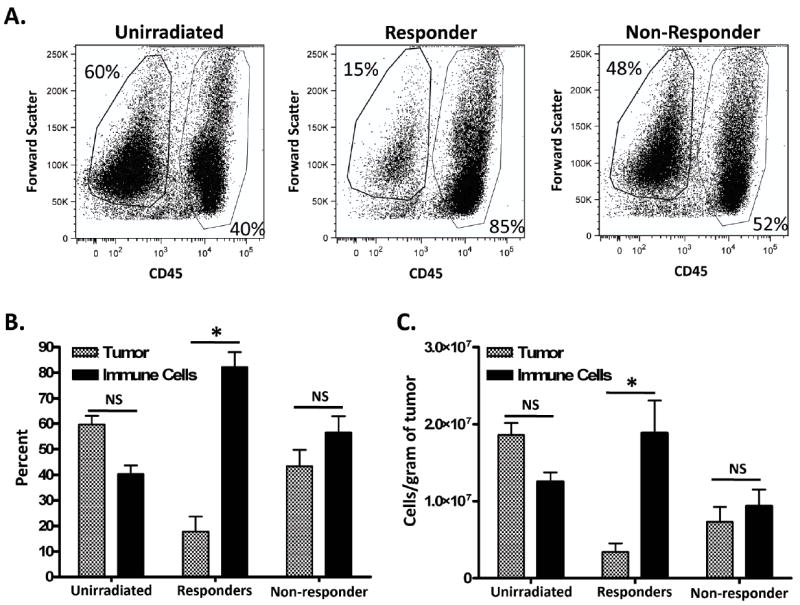
Figure 2. Immune cells are increased in responder tumors.

Tumors were characterized as responders or non-responders to radiotherapy (RT on day 7), removed on day 11, dissociated into a single cell suspension and examined by flow cytometry. (A) Representative dot plots of samples that were gated for immune cells (CD45+) or tumor cells (CD45-). Percentage (B) or standardized number (C) of tumor cells compared to immune cells between groups. * represents significance (p < 0.05) as determined by ANOVA and Bonferroni post-hoc test. n=7 for unirradiated; 6 for responders; 5 for non-responders.
