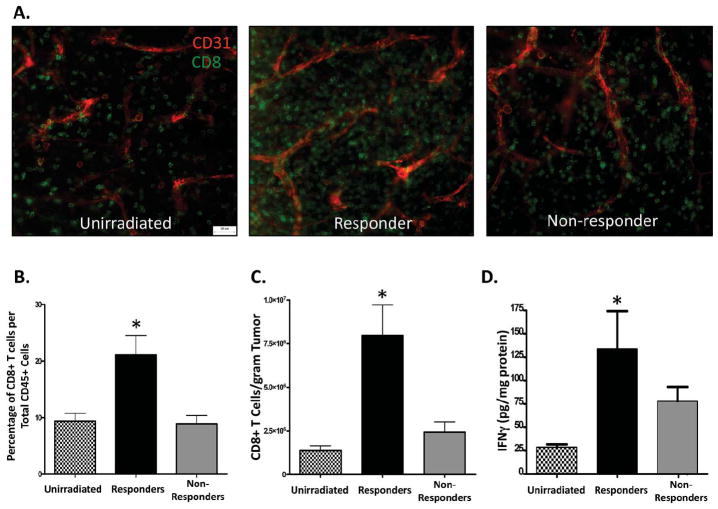
Figure 3. Responder tumors have enhanced numbers of CD8+ T cells and amounts of intratumoral IFNγ.
Day 11 tumor pieces were analyzed by whole mount histology for CD8+ T cells (green) and CD31+ blood vessels (red). Representative images of unirradiated, responder, and non-responder tumors are presented as overlays and illustrated in (A). Tumors were examined by flow cytometry on day 11 as described in figure 2. Immune cells were first gated for CD45+ cells followed by gating on CD8+ cells and presented as percentage (B) or standardized number (C). (D) Tumors were homogenized and intratumoral IFNγ was examined by ELISA and normalized to total protein. * represents significance (p < 0.05) as determined by ANOVA and Bonferroni post-hoc test. n=7 for unirradiated; 6 for responders; 5 for non-responders.

