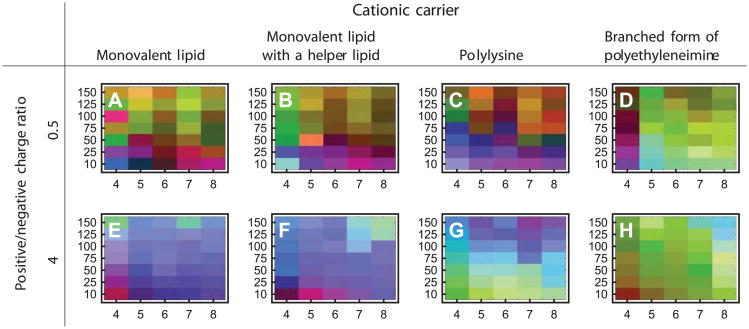
Figure 11.
Ionic strength-pH empirical phase diagrams of various nonviral gene delivery complexes formed between plasmid DNA and four cationic carriers.28 Each EPD has pH as the horizontal axis and ionic strength (mM) as the vertical axis. The experimental techniques used were DLS, CD, and YOYO-1 EF.

