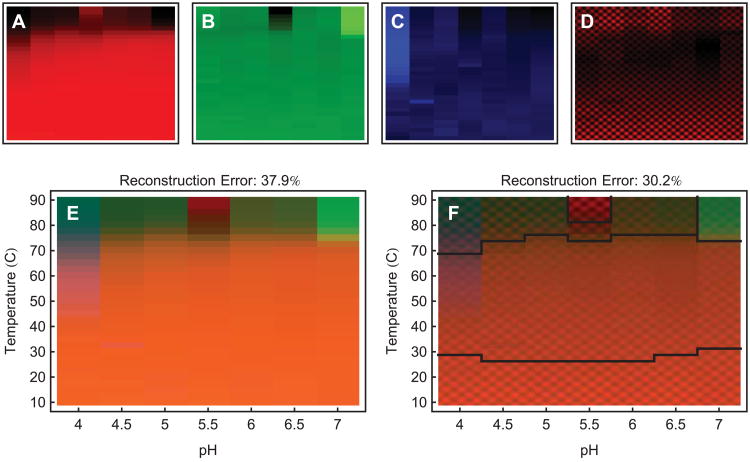
Figure 12.
When the projection error is large it can be reduced by incorporating more dimensions. In (A)-(C), we show the primary color images (red, green and blue) of an empirical phase diagram. They are ordered by descending significance from left to right. For axis information, see (E) and (F). After solid red, green, and blue, we can use images containing structure that is smaller than the individual phase diagram blocks. This will represent high dimensional information as changes in texture. Such an image is shown in (D). (E) is a 3 dimensional empirical phase diagram of IgG, using FTIR spectra which have been preprocessed with a Fourier filter to emphasize mid-size spectral features. (F) is a 4 dimensional empirical phase diagram of the same data as (E), showing fourth dimensional information as changes in texture. Notice that the reconstruction error has decreased. The diagram has also been automatically segmented into 5 parts (see text).

