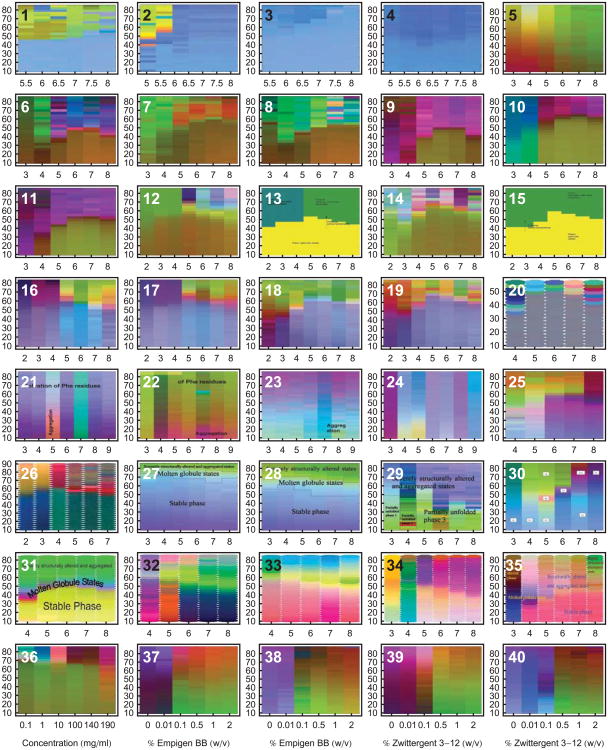
Figure 2.
Empirical phase diagrams have found many uses in the optimization of various types of formulations. Many case studies have been published concerning their application to various systems and their extension by the addition of measurement techniques and search space variables. The EPDs in this figure are only from papers published in the Journal of Pharmaceutical Sciences. Many more EPDs have been published in other journals or generated in proprietary studies. Refer to Table 2 for more information concerning each EPD. All EPDs in this diagram have temperature (°C) as the vertical axis. Diagrams 1-35 use pH on the horizontal axis, and diagrams 36-40 have the indicated stress variables on the horizontal axis. All EPDs in this article have been reformatted for uniform layout.

