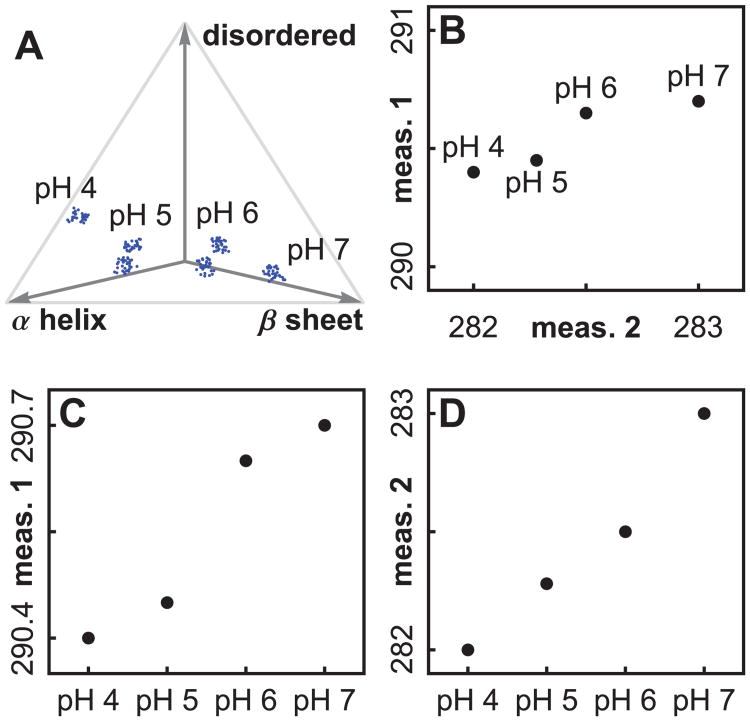
Figure 3.
An illustration of three types of spaces, using simulated data. In Figure (A), four pH values define a one dimensional search grid in search space, and ratios of secondary structure type illustrate a protein phase space. Figure (B) shows how two measurement types define a measurement phase space. The transition pH values disagree when we plot measurements separately, as in Figures (C) and (D). A plot in measurement phase space (B) synthesizes the information, but will not work as a visual aid for high dimensional data.

