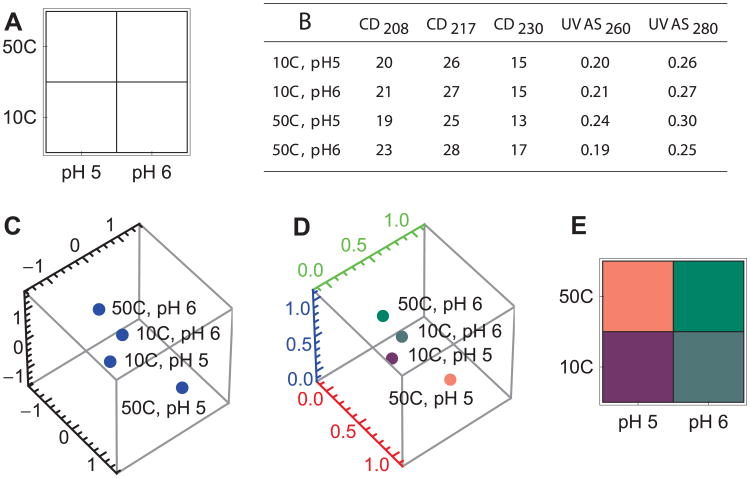
Figure 6.
Illustration of the steps in the Empirical Phase Diagram method, using simulated data. (A): Choose a search space and a search grid. In this case, the search space is 2 dimensional, varying temperature and pH. In each dimension, two values have been chosen, forming a grid. (B): Collect data at each point of the search grid. The data in this example is 5 dimensional. (C): Standardize the data and project it into 3 dimensions. (D): Rescale to the range (0,1), and express as a color. (E): Transform the colors into an image.

