Figure 7.
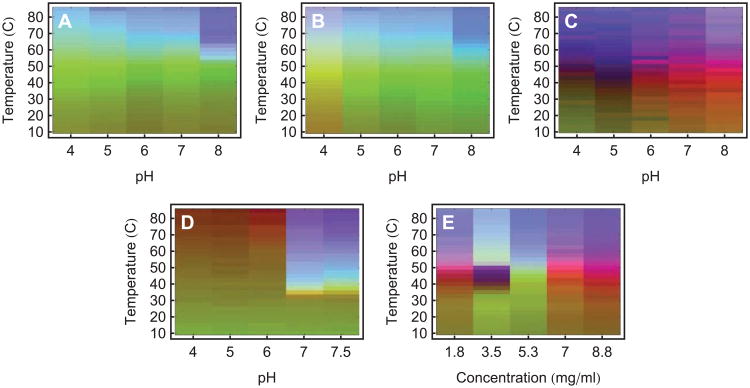
Empirical phase diagrams(EPDs) of the peptide drug pramlintide at low and high concentration,7 and concentration dependence at pH 4. Low concentrations (0.088 mg/ml) are represented in A-C. The experimental techniques used to construct A-C were as follows: (A) second derivative UV absorbance peak shift and OD350, (B) same as (A), adding fluorescence intensity and peak shift, (C) same as (B), adding the CD change at 204 nm. The peptide at high concentration (8.8 mg/mL) is represented in (D), using the same experimental techniques as (B). An EPD at pH 4 as a function of peptide concentration is shown in (E), using the same experimental techniques as (B).

