
Figure 3. Histologic analysis of tumors and organs of mice treated with MV-m-uPA.
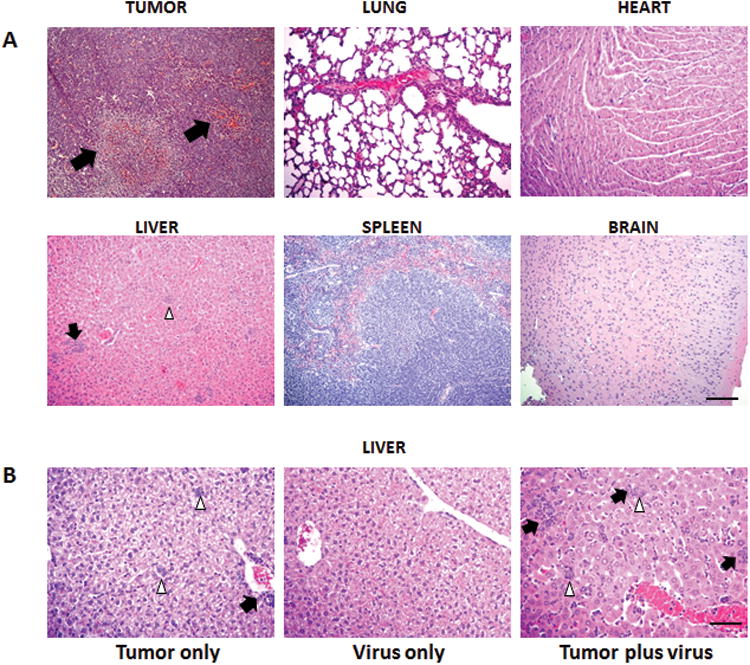
(A). 4T1 tumor bearing Balb/c mice (n = 5) were given 2 doses of 1.5×10⁶ TCID50 of MV-m-uPA or PBS via tail vein. Mice were sacrificed 5 days after virus treatment and primary tumors and major organs (lung, heart, liver, spleen and brain) were removed for histological analysis (H&E). Arrows indicate the necrotic and inflammatory areas. White arrowheads (liver) represent tumor foci. Scale bar = 400 μm. (B). Effects of MV-m-uPA in the liver of tumor bearing and tumor free mice (n=5 per group). Virus treatment and tissue processing was performed as in methods section. Representative pictures of livers in the 3 groups. Left: Tumor bearing mice treated with PBS (micrometastases detected in 5/5 mice). Center: Tumor free mice treated with virus. Right: Tumor bearing mice treated with virus (micrometastases detected in 2/5 mice, picture is shown from a mouse with positive micrometastases). Note micrometastatic foci (white arrowheads) and areas of inflammation (black arrows). Scale bar = 200 μm.