
Figure 5. In vivo antitumor effects and tumor targeting in mammary and colon cancer models.
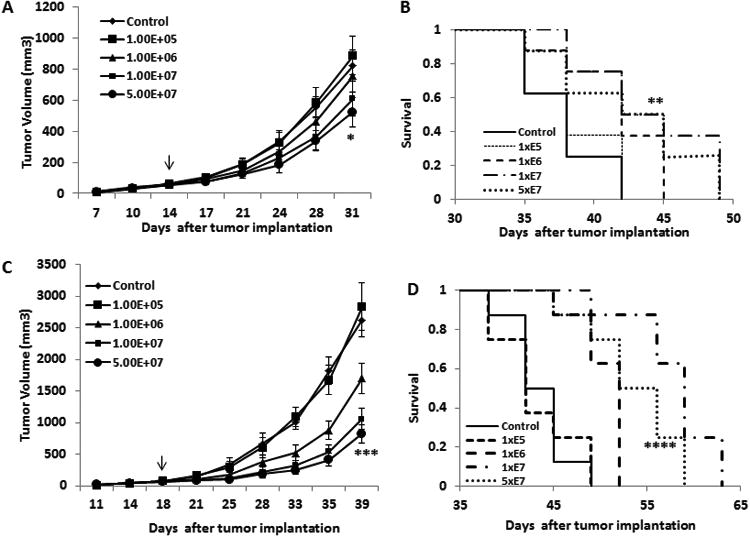
(A). 4T1 cells were implanted into the mammary fat pad of female Balb/c mice. When tumors reached a mean diameter of 0.4-0.5 cm, the animals (8 per group) were treated with total doses of 1×10⁵, 1×10⁶, 1×10⁷, 5×10⁷ TCID50 of MV-m-uPA, or equal volumes of PBS (control group). Total doses were split in three separate administrations, given via tail vein every other day × 3. Tumor growth was monitored as in methods. * p < 0.0001, day 17, MV-m-uPA (5×10⁷) vs. control. Arrow indicates the time (day) of MV treatment, relative to time of tumor cell implantation. (B). Kaplan-Mier analysis of survival of tumor bearing mice treated with vehicle control or MV-m-uPA. Mice were monitored until they reached sacrifice criteria (see materials and methods). MV-m-uPA 5×10⁷ vs. control ** p=0.0006. (C). Murine colon cancer (CT-26) cells were implanted into the right flank of female Balb/c mice. When the tumors reached a mean diameter of 0.4-0.5 cm, the animals (8 per group) were treated and followed as in the 4T1 model. *** p < 0.0001: day 21, MV-m-uPA (5×10⁷) vs. control. Arrow indicates the time (day) of MV treatment, relative to time of tumor cell implantation. (D). Kaplan-Mier analysis of survival of tumor bearing mice treated with vehicle control or MV-m-uPA. There was a significant prolongation of survival in the MV-m-uPA treatment group compared with control. **** p=0.0297, MV-m-uPA 5×10⁷ vs. control.