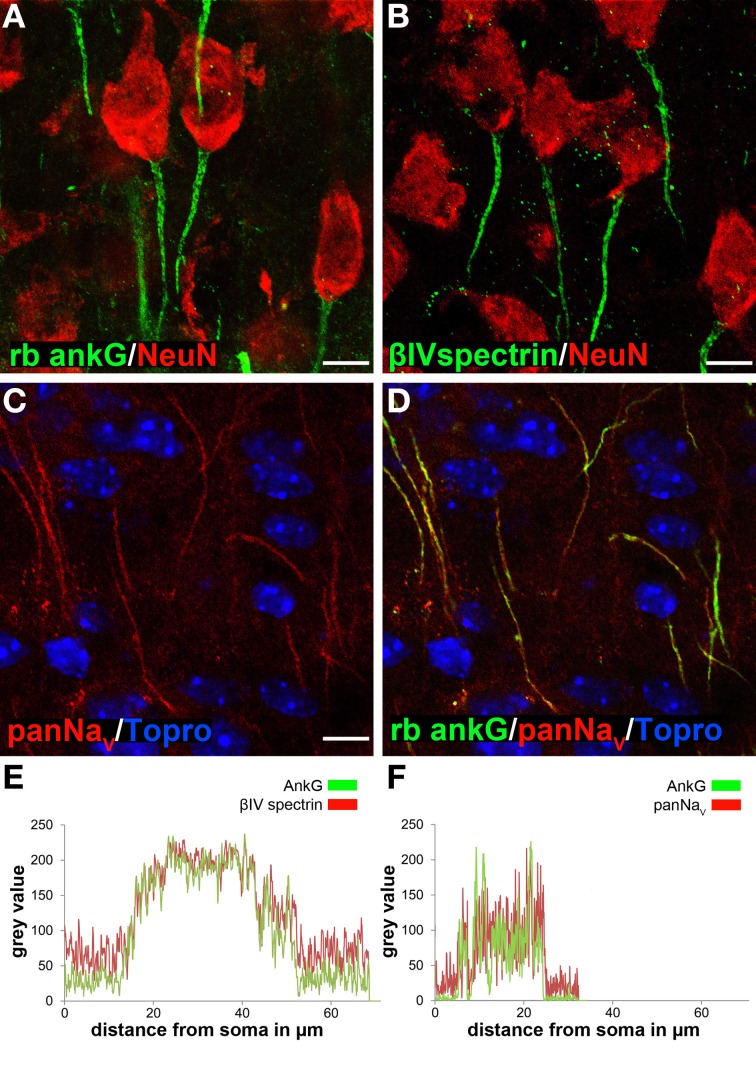
Figure 1.
Ankyrin-G as a reliable marker for AIS length analysis in cortical neurons. AIS were specifically stained using various markers. (A) AnkG (green) and NeuN (red) in layer II/III neurons in a P35 animal. (B) βIV spectrin (green) and NeuN (red) in layer II/III neurons in a P35 animal. (C) PanNaV (red) in layer II/III neurons in a P15 animal. (D) Merged image of C and ankG (green) with TO-PRO©-3 (blue) as nuclear stain, showing complete overlap of ankG and panNaV signals. (E) Fluorescence intensity profile for AIS markers ankG (green) and βIV spectrin (red) in an example of a long AIS in a P15 animal, indicating signal overlap for the same AIS distance from the soma. (F) Fluorescence intensity profile for ankG (green) and panNaV (red), here in an example of a short AIS (P15). Again, signals overlapped with both markers. Scale bars (A–D) = 20 μm.

