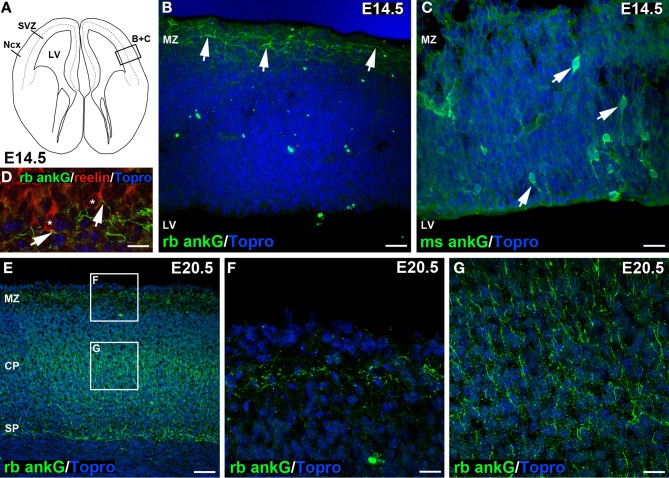
Figure 2.
Distinct ankG signal in embryonic sections at E14.5 and E20.5. (A) Line graph of an E14.5 coronal section of mouse brain, modified from Schambra et al. (1991). Box indicating (B) + (C) highlights region of interest depicted in (B,C). (B) Distinct ankG immunosignal at E14.5 resulting from polyclonal rabbit antibody (green) was localized to AIS of putative Cajal-Retzius cells in the marginal zone (MZ, arrows), also shown in (D). AIS appear predominantly horizontal along the pial surface of the cortex. (C) Somatodendritic ankG immunosignal resulting from usage of monoclonal mouse antibody (green) at E14.5. Cells appear mostly bipolar with processes extending from the soma (arrows). No AIS were observed at E14.5 with this antibody. (D) Reelin-positive Cajal-Retzius cells (red, soma delineated by asterisk) with ankG (green) along their putative AIS (arrows) in a predominantly horizontal orientation in an E14.5 brain. (E) Overview of E20.5 cortex showing rabbit anti ankG immunoreactive AIS (green) with distribution along the MZ, a broad band within the cortical plate (CP) and subplate (SP). (F) Magnification of upper box in E indicating AIS in the MZ at E20.5 in horizontal orientation. (G) Magnification of lower box in E with rabbit anti ankG-positive AIS (green) in the CP in predominantly perpendicular orientation. LV, lateral ventricle; Ncx, Neocortex; (S)VZ, (sub)ventricular zone; MZ, marginal zone; CP, cortical plate; SP, subplate. Scale bars (A,B) = 35 μm, (D) = 10 μm, (E–G) = 25 μm, (F) = 50 μm.

