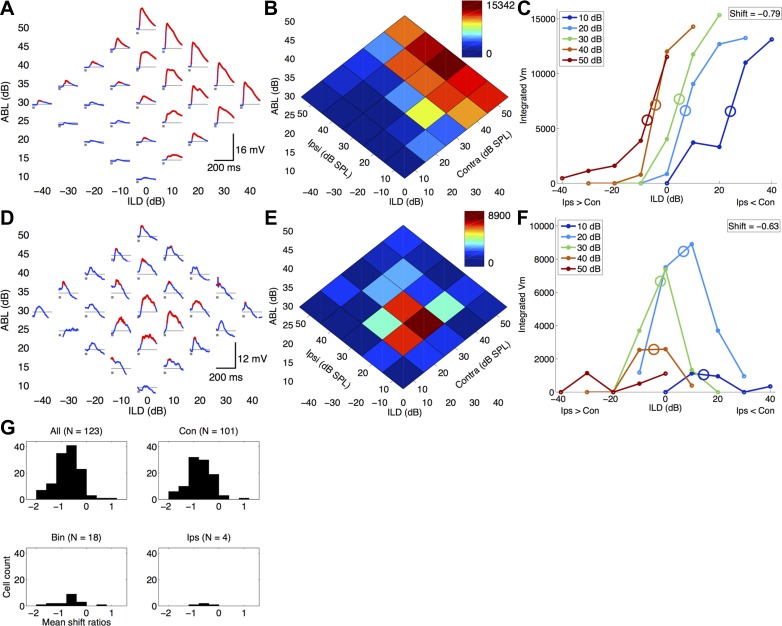
Fig. 2.
Membrane potential (Vm) ILD responses in the rat auditory cortex shift toward the ipsilateral ear with increasing ipsilateral sound level. A–F: 2 representative examples showing negative ILD response shifts in both contralateral-preferring (A–C; cell 010511-MK-3-8) and binaural-preferring (D–F; cell 080910-MK-2-2) nonspiking cells. A and D: membrane potential responses to the binaural stimulus array. Each subplot shows the membrane potential (A: mean of 20 trials; D: mean of 10 trials). White noise bursts (25 ms duration) are indicated in gray. Resting membrane potential (Vrest) is indicated by horizontal thin gray line (A: Vrest = −78.8 mV; D: Vrest = −60.2 mV). Red regions are significantly above baseline and were included in the integrated membrane potential responses in B and C. B and E: normalized integrated membrane potential heat maps of the same data shown in A and D. Dark red indicates maximum depolarization, and dark blue indicates minimum depolarization. C and F: integrated membrane potential ILD response curves. Ipsilateral level held constant for each curve as a function of ILD. C: contralateral-preferring cell with a mean ILD response shift of −0.79 dB/dB (SD = 0.68). F: binaural-preferring cell with a mean ILD response shift of −0.63 dB/dB (SD = 0.33). G: population histograms showing that the majority of cells (95.9%) have negative membrane potential response shifts (top left, 118/123 cells), regardless of binaural preference categorization.

