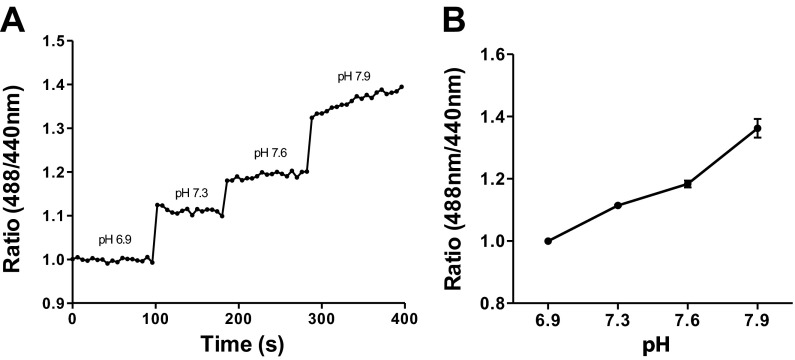
Fig. 3.
Calibration curve for membrane-associated HAF fluorescence. A: HAF calibration via epifluorescent imaging; cells were stained with the 500 nM HAF staining protocol, and Ringer solutions of known pH values were applied to the bath. Cells were alternately stimulated with 488- and 440-nm light; fluorescence emitted at 530 nm and beyond was collected. An area of ∼20 μm in the central portion of the soma was selected as the region of interest and the ratio of light emitted at 488/440 nm plotted. B: average calibration of 7 cells exhibiting membrane-associated HAF fluorescence.

