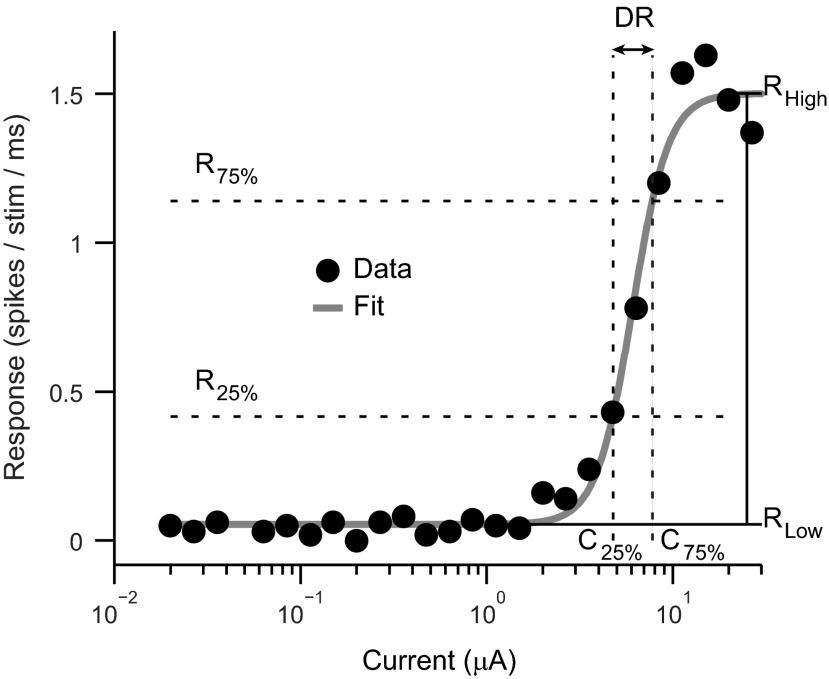
Fig. 4.
Example cortical activation curve. Responses from a recording site evoked by thalamic electrical stimulation are shown. The activation curve was fitted with a sigmoidal function, and multiple parameters were obtained: RLow, lower asymptotic response level; RHigh, upper asymptotic response level; R25% and R75%, response levels 25% and 75% above RLow; C25% and C75%, currents corresponding to the response levels 25% and 75% above RLow; and DR, dynamic range (in dB) between C25% and C75%.

