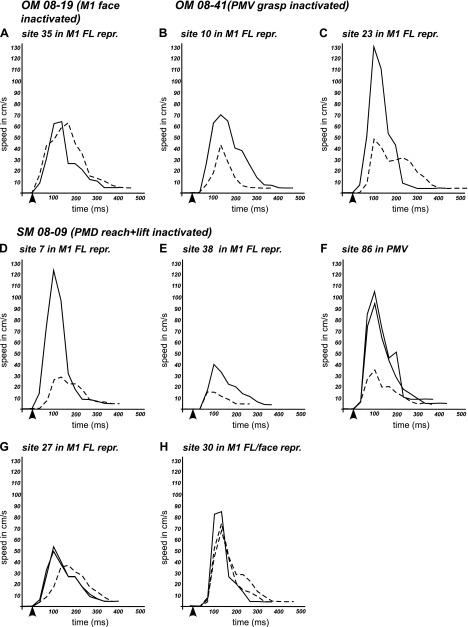
Fig. 13.
Speed profiles of hand movements trajectories traced from selected sites in M1 and PMV in cases with muscimol inactivation of M1 face domain (A), PMV grasp domain (B and C), and PMD reach domain (D–H). Each graph includes the speed profile of the original movement (solid line) and movement evoked during retesting (dashed line). Black arrowheads indicate the start of microstimulation train. Note the lower peak speeds for most movements evoked after muscimol application.

