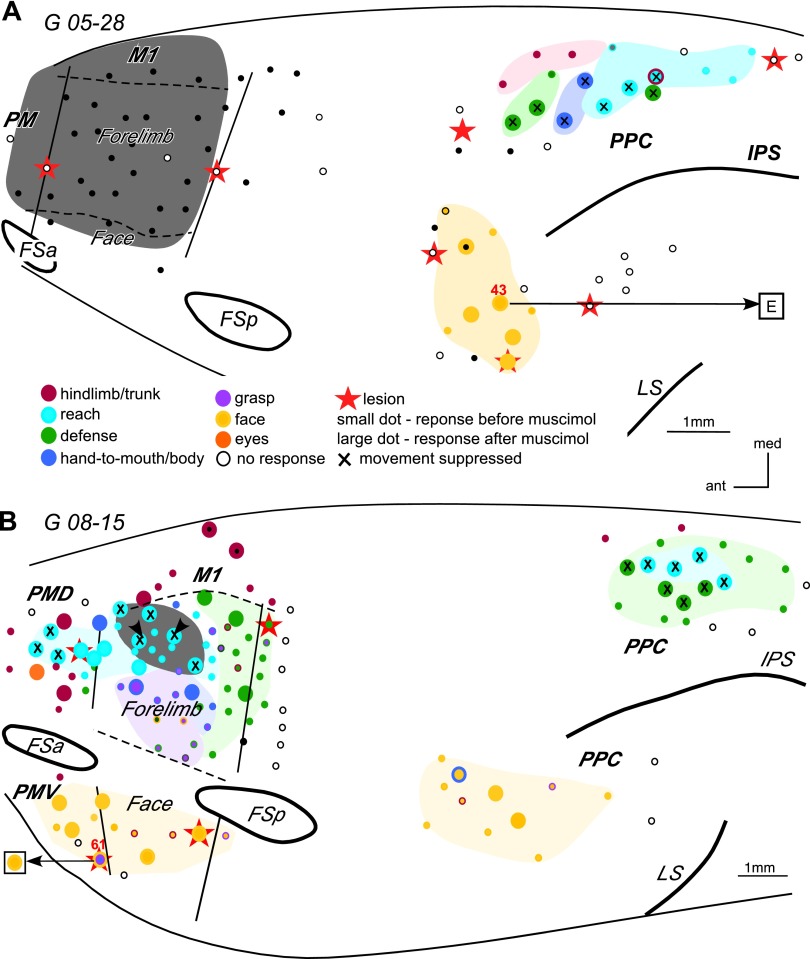
Fig. 3.
Schematic illustration of the effects of inactivating the entire M1 forelimb representation in G 05–28 (A), and the M1 reaching domain in G 08–15 on other functional domains (B). The grey area in A depicts the approximate location of the muscimol application with gelfoam. Arrowheads in B depict the location of 2 muscimol injections. In A and B, dots represent microstimulation sites. Small dots represent sites that were stimulated before muscimol injections. Large dots represent sites that were stimulated before and after muscimol injections. Large dots with a small black dot in the center represent sites that were stimulated after musimol injection, but not before. Areas highlighted in light colors depict the approximate extent of a functional domain or a cluster of sites that evoked similar movements. Thin solid lines mark approximate areal borders and dashed lines mark borders between body representations within M1. Arrows from a stimulation sites point to the responses evoked during retesting (shown in squares). For example, in A stimulation of all sites in ventral PPC evoked concurrent face grimace and ear movements. Inactivation of the M1 forelimb representation suppressed the face movements evoked from PPC, but the ear movements could still be evoked (site 43). In B stimulation of site 61 in PMV evoked grasp followed by hand-to-mouth and mouth opening. Inactivation of the M1 reach domain suppressed the forelimb movements evoked from PMV, but mouth opening was still evoked. Other conventions as in Fig. 2.

