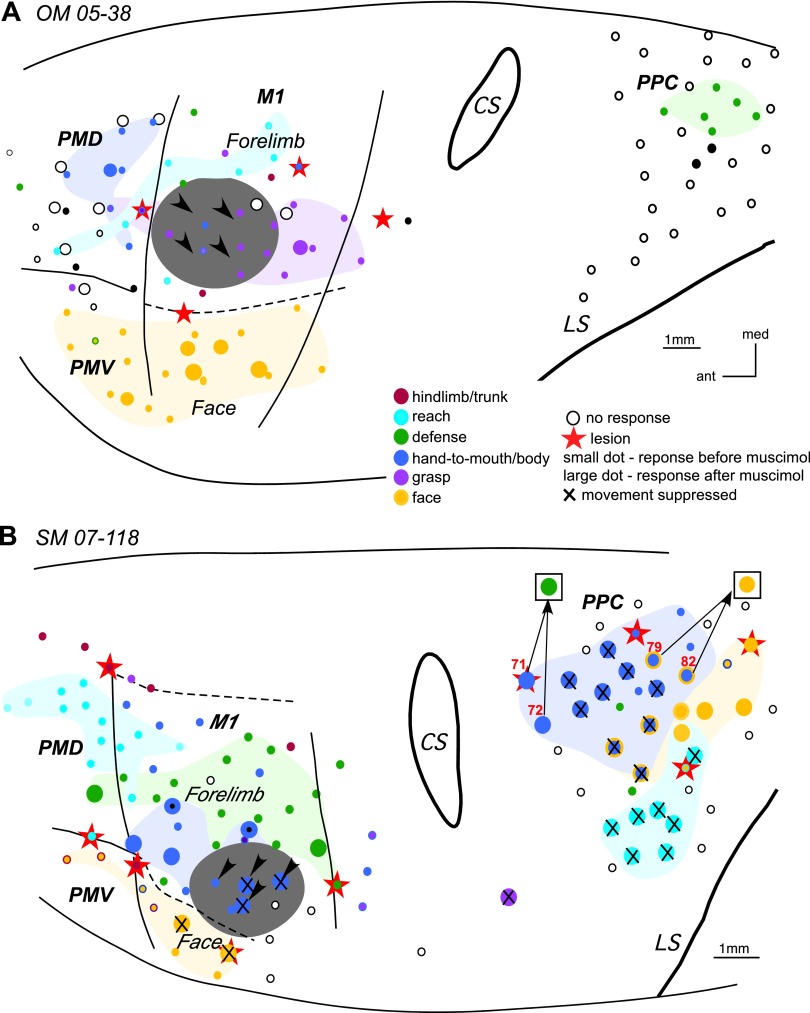
Fig. 4.
The effect of inactivation of M1 grasp domain in OM 05–38 (A) and inactivation of M1 hand-to-mouth domain in SM 07–118 (B). In A large circles depict retested sites that were close, but did not overlap the original sites, which are depicted as small dots. Black dots in PMD and PPC depict sites that evoked ear movements. In B note the change in movement sequences evoked from PPC sites (71, 72, 79, 82) during retesting. Arrows from a stimulation sites point to the responses evoked during retesting (shown in squares). For detailed description of results, see the text. Other conventions as in Figs. 2 and 3.

