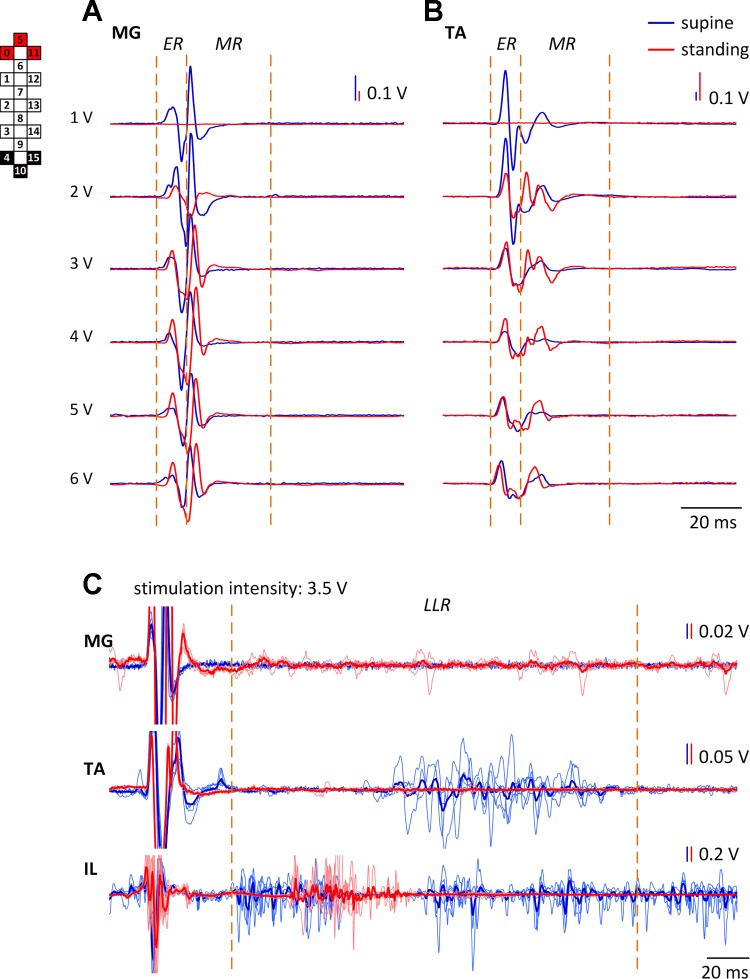
Fig. 7.
Evoked potentials (ER and MR) in participant A45 during wide-field caudal (4−/10−/15−//0+/5+/11+) stimulation configuration in MG (A) and TA (B) in the supine and standing [body weight load (BWL) = 60%] positions. The average of 5 nonrectified responses is shown for each stimulation intensity. Orange, dashed lines show the epochs of the ER and MR. C: the long latency responses (LLR) in MG, TA, and IL muscles are presented for both positions at the stimulation intensity of 3.5 V. The thin lines indicate individual trials, whereas the bold lines indicate the average of 5 trials recorded in the supine (blue) and standing (red) positions. Orange, dashed lines show the epoch the LLR. Cathode (active) and anode (reference) electrodes are shown in black and red, respectively.

