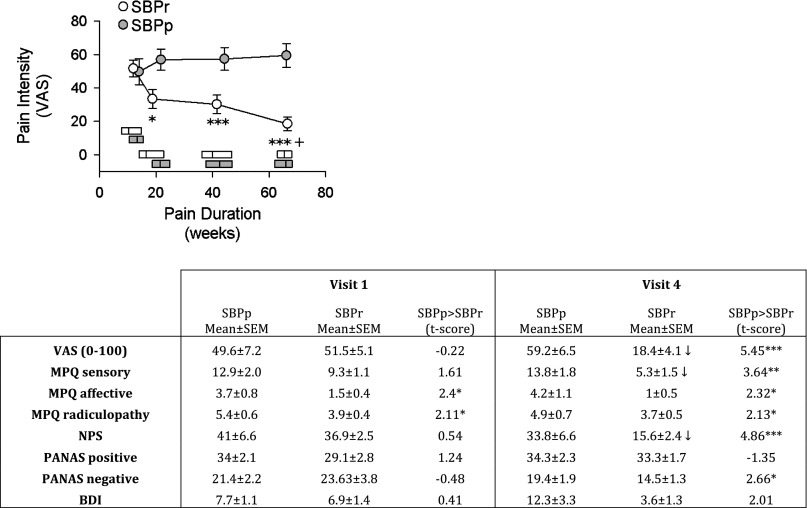
Fig. 1.
Pain characteristics in subacute back pain (SBP) patients, as a function of grouping and time. Top: graph shows that SBP patients whose pain resolves (SBPr, n = 16) report decreases in pain on a visual analog scale (VAS) over the course of the study and ultimately differ significantly from SBP patients whose pain persists (SBPp, n = 14). Horizontal bars represent median and interquartile range of pain durations for each group. rm-ANOVA showed a significant group × time effect (P < 10−5). Post hoc (Tukey) tests: +P <0.05, within-group comparison to visit 1; *P < 0.05, ***P < 0.001, comparison between groups at corresponding times. Bottom: table shows pain and mood parameter differences for SBPp and SBPr. Significant decreases between visit 1 (at entry into the study) and visit 4 (1 yr after entry into study) (paired t-test, P < 0.01) are displayed as ↓. MPQ, McGill Pain Questionnaire; NPS, Neuropathic pain scale; BDI, Beck's Depression Inventory. PANAS, Positive Affect Negative Affect Scale. *P < 0.05, **P < 0.01, ***P < 0.001, unpaired t-test.

